
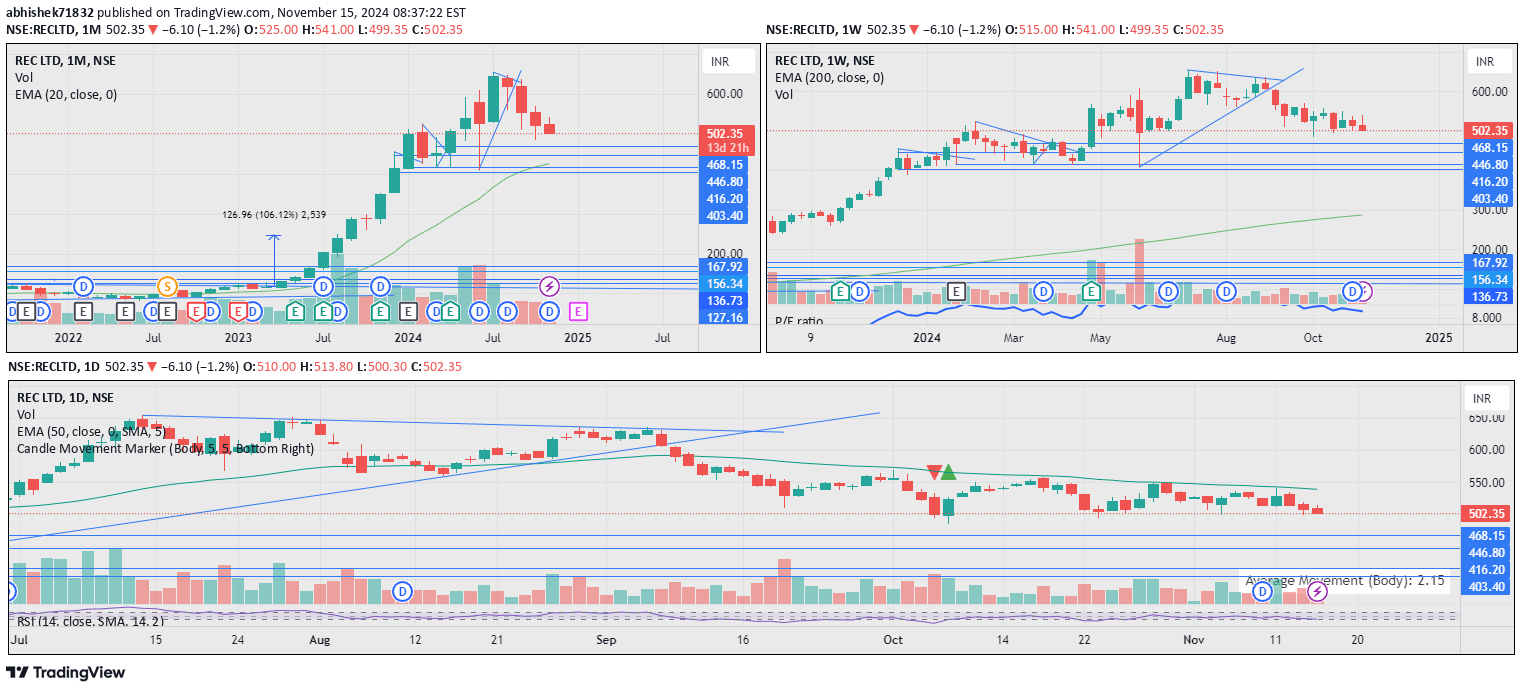
A powerful Pine Script indicator that identifies significant price movements within candles by marking volatile periods and providing visual cues for trading decisions.
Explore complementary indicator rolesHow it works
The Candle Movement Marker analyzes price candles by measuring their movement range based on either full candle range (High-Low) or candle body (Open-Close). Traders can set a custom percentage threshold to determine which candles are considered significant movements.
When a candle meets the specified movement criteria, the indicator dynamically places bullish (green) or bearish (red) arrows on the chart. It simultaneously calculates and displays the average movement of the last 'N' candles in a configurable information box, providing traders with a comprehensive view of price action.
Why it may be useful
This indicator helps traders quickly identify and visualize significant price movements, which is crucial for understanding market dynamics and potential trading opportunities. By marking volatile candles with color-coded arrows, it provides an intuitive way to recognize substantial price changes that might indicate trend shifts or momentum.
The ability to customize movement detection and view average movement metrics allows traders to adapt the tool to different market conditions and trading styles. This flexibility makes the Candle Movement Marker a versatile tool for analyzing price behavior across various financial instruments and timeframes.
When to explore it
The Candle Movement Marker is most effective during periods of market volatility, such as during major economic news releases, earnings announcements, or significant market events. Traders can use this indicator to identify potential breakout opportunities or to confirm existing trend movements.
It is particularly useful for momentum traders, breakout strategies, and those looking to understand rapid price changes. The indicator can be applied across different timeframes, making it valuable for scalpers, day traders, and swing traders seeking to capture significant market movements.
Keep exploring
What we’ve verified
Access, alerts and repainting behaviour have not been independently verified for this indicator. Check the creator’s current publication and settings.
General descriptions and classifications are recovered research. Verified details above identify the specific checks we have completed. Check the creator’s current publication for later changes.


