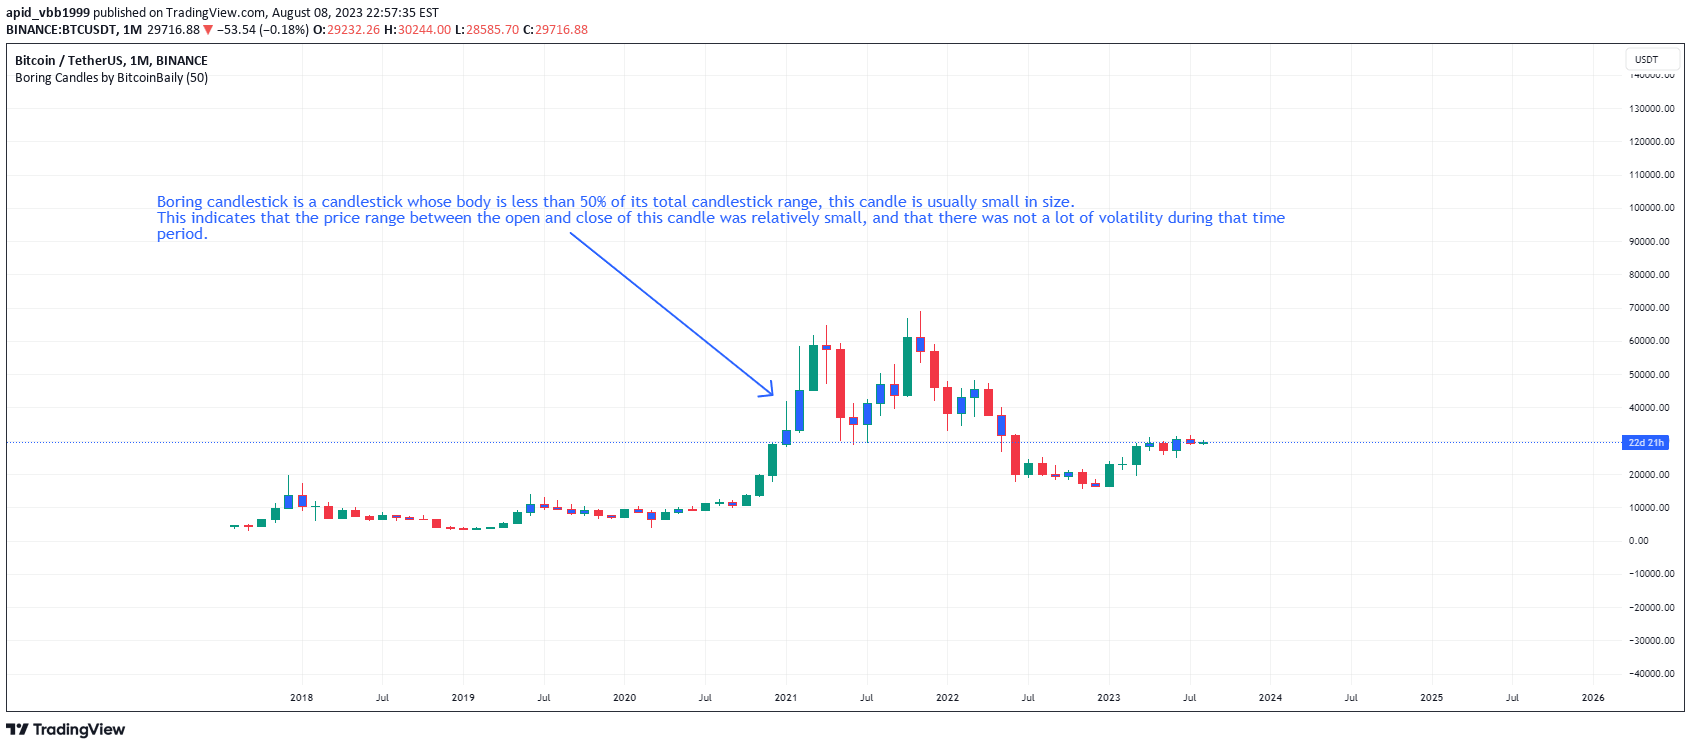
A candle signal identifying significant price rejection by measuring the wick's length relative to the total candle range, indicating potential market sentiment shifts.
Explore complementary indicator rolesHow it works
The signal focuses on analyzing individual candlesticks where the wick represents at least 50% of the total candle range, measuring from the high to the low price. This measurement indicates substantial price rejection during that trading period, suggesting strong market dynamics and potential sentiment changes within a single time frame.
By comparing the wick's length to the total candle body, traders can identify moments where market participants strongly pushed price in one direction but were ultimately rejected, creating a significant psychological marker of potential trend reversal or continuation.
Why it may be useful
This candlestick analysis helps traders understand market sentiment and potential price action dynamics by revealing moments of significant price rejection. It provides insights into the psychological battle between buyers and sellers, highlighting instances where one side attempted to push the price but was ultimately unsuccessful.
By recognizing these price rejection signals, traders can make more informed decisions about potential trend reversals, entry and exit points, and overall market momentum. The signal serves as a visual representation of market sentiment and potential turning points in price movement.
When to explore it
The signal works best in volatile market conditions where price movements are more dynamic and traders are seeking clear indications of market sentiment shifts. It is particularly useful in markets with high liquidity and frequent price fluctuations, such as forex, cryptocurrency, and actively traded stock markets.
Traders should apply this signal in conjunction with other technical analysis tools to confirm potential trade setups. It is most effective when used on shorter timeframes like 1-minute, 5-minute, and 15-minute charts, where rapid price movements and quick sentiment changes are more pronounced.
Keep exploring
What we’ve verified
Access, alerts and repainting behaviour have not been independently verified for this indicator. Check the creator’s current publication and settings.
General descriptions and classifications are recovered research. Verified details above identify the specific checks we have completed. Check the creator’s current publication for later changes.