
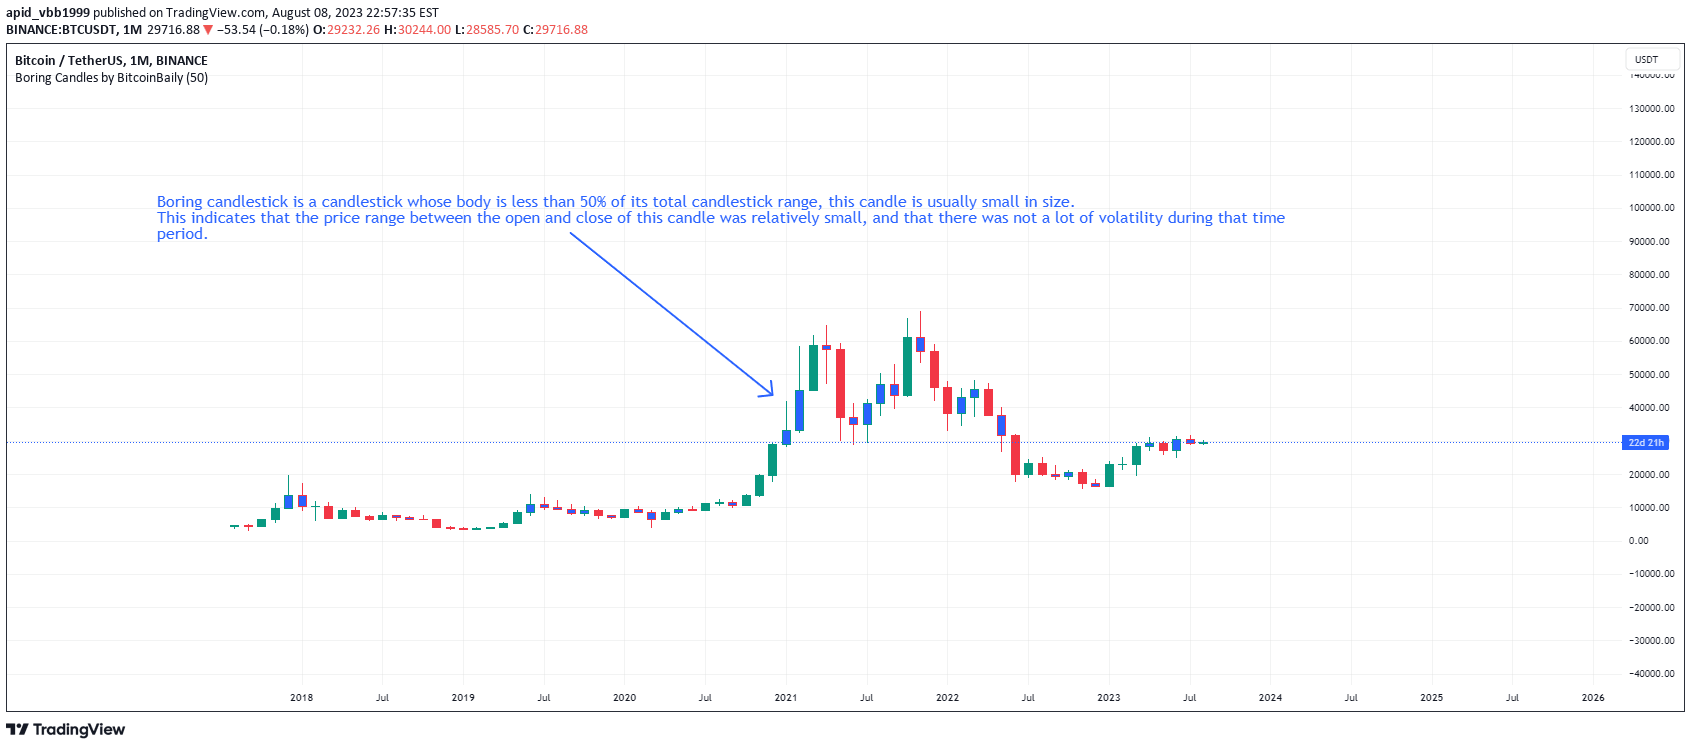
A candlestick pattern characterized by a small body, indicating minimal price movement and low volatility during a specific trading period.
Explore complementary indicator rolesHow it works
A boring candlestick forms when the price opens and closes very close to each other, creating a small body that represents less than 50% of the total candlestick range. This means that the high and low prices of the candlestick are significantly larger than the distance between the open and close prices.
The small body suggests that neither buyers nor sellers were able to gain significant momentum during that trading period, resulting in a relatively stable price movement. Traders analyze these candlesticks as potential indicators of market indecision or consolidation.
Why it may be useful
Boring candlesticks provide valuable insights into market sentiment and potential trend dynamics by revealing periods of low volatility and market uncertainty. They help traders identify moments when the market is experiencing minimal price movement, which can be crucial for understanding potential future price actions.
By recognizing these candlesticks, traders can anticipate potential breakouts, consolidation periods, or shifts in market momentum. They serve as important visual cues that complement other technical analysis tools in making informed trading decisions.
When to explore it
Boring candlesticks are most effective when used in conjunction with other technical analysis tools and within the context of the broader market trend. They are particularly useful during periods of market consolidation or when traders are looking for potential trend reversal or continuation signals.
Traders should pay special attention to these candlesticks when they appear near key support and resistance levels, as they might indicate a potential breakout or breakdown. They are especially valuable in short-term trading strategies like scalping and day trading, where understanding micro-movements is crucial.
Keep exploring
What we’ve verified
Access, alerts and repainting behaviour have not been independently verified for this indicator. Check the creator’s current publication and settings.
General descriptions and classifications are recovered research. Verified details above identify the specific checks we have completed. Check the creator’s current publication for later changes.


