
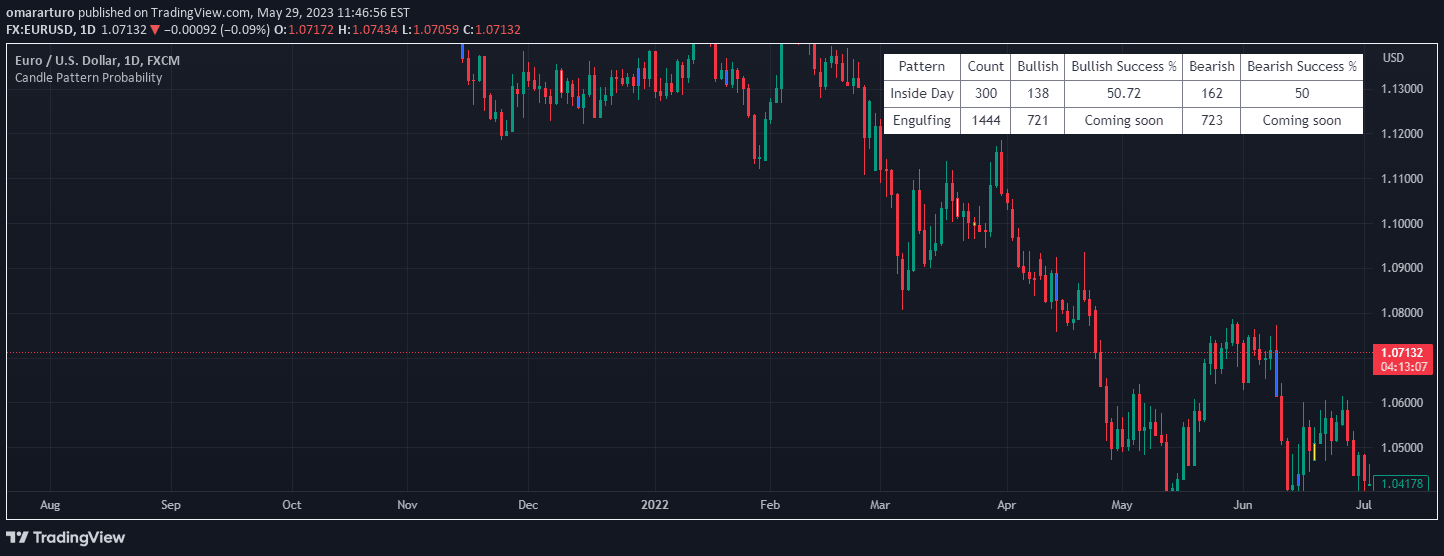
A technical analysis tool that calculates the probability of success for different candlestick patterns by analyzing historical market data and estimating potential price movements.
Explore complementary indicator rolesHow it works
The Candle Pattern Probability indicator uses sophisticated statistical algorithms to analyze historical candlestick formations and their subsequent market movements. It systematically examines a wide range of candlestick patterns, such as hammers, shooting stars, engulfing patterns, and dojis, tracking their frequency and effectiveness in past market conditions.
By compiling extensive historical data, the indicator calculates the likelihood of specific candlestick patterns leading to predictable price actions. It generates a percentage-based probability or color-coded visualization that helps traders quickly understand the potential success rate of a particular candlestick formation in the current market context.
Why it may be useful
Candlestick pattern analysis provides traders with valuable insights into market psychology and potential trend reversals that might not be immediately apparent through traditional price charts. By quantifying the historical performance of specific candlestick formations, traders can make more informed decisions about potential entry and exit points.
The indicator transforms subjective pattern recognition into a more objective, data-driven approach. It helps traders understand the statistical likelihood of a pattern's success, reducing emotional decision-making and providing a systematic method for evaluating market movements based on proven historical precedents.
When to explore it
The Candle Pattern Probability indicator is most effective in markets with clear, recurring price patterns and sufficient historical data. It works best when applied to liquid markets with consistent trading volumes, such as major currency pairs, stock indices, and widely-traded commodities.
Traders should use this indicator as part of a comprehensive trading strategy, combining its insights with other technical indicators, fundamental analysis, and risk management techniques. It is particularly useful for traders seeking to validate potential trade setups, confirm trend reversals, and enhance their understanding of market dynamics.
Keep exploring
What we’ve verified
Access, alerts and repainting behaviour have not been independently verified for this indicator. Check the creator’s current publication and settings.
General descriptions and classifications are recovered research. Verified details above identify the specific checks we have completed. Check the creator’s current publication for later changes.


