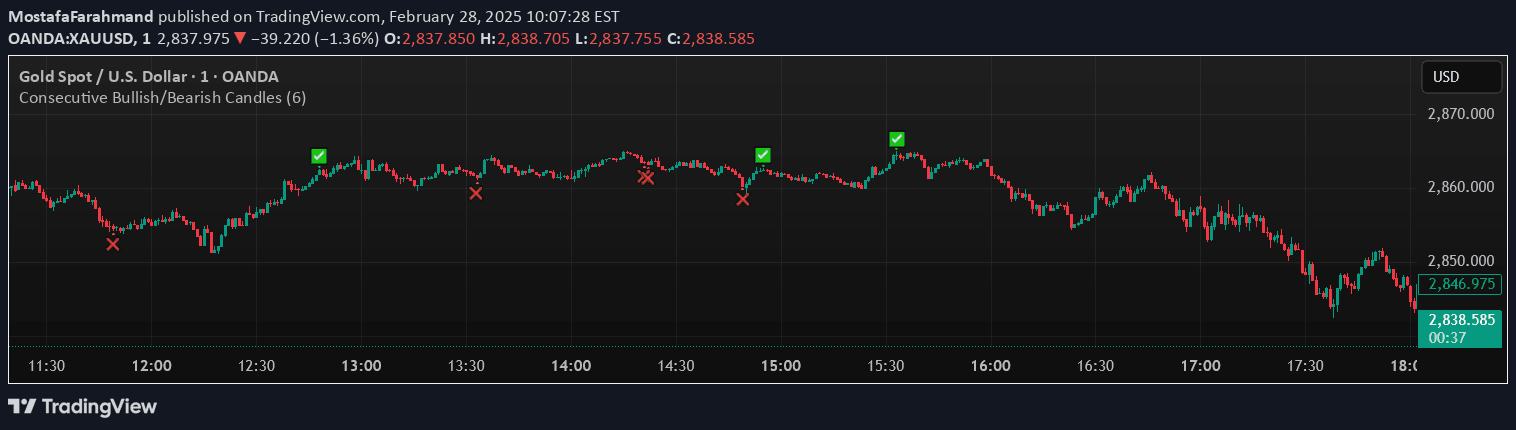
A trading indicator that calculates and visualizes the absolute size of price candles using a histogram with an optional moving average to track candle size trends.
Explore complementary indicator rolesHow it works
The indicator measures the absolute size of price candles by comparing their open, close, high, and low values to determine the total price movement. It creates a histogram representation of these candle sizes, allowing traders to visually assess the magnitude of price changes for each trading period.
Additionally, the indicator incorporates a customizable simple moving average that tracks the average candle size over a specified lookback period. This moving average helps traders understand the typical price movement range and identify when current candle sizes deviate significantly from the historical average.
Why it may be useful
Understanding candle size is crucial for traders seeking to assess market volatility and potential price momentum. By visualizing the absolute size of price movements, traders can quickly identify periods of increased or decreased market activity, which can signal potential trend changes or trading opportunities.
The moving average component provides additional context by establishing a baseline for typical price movement, enabling traders to recognize when market conditions are becoming more or less volatile. This insight can help in risk management, trade selection, and developing more sophisticated trading strategies.
When to explore it
This indicator is most effective in markets with consistent price movement and during periods of potential trend transitions. Traders can use it to identify unusual market conditions, such as sudden increases in volatility or periods of consolidation where candle sizes become consistently smaller.
It is particularly useful for day traders and scalpers who rely on understanding short-term price dynamics. By monitoring candle sizes, traders can adapt their strategies to changing market conditions, set more accurate stop-loss levels, and potentially anticipate breakouts or trend reversals based on changes in price movement magnitude.
Keep exploring
What we’ve verified
Access, alerts and repainting behaviour have not been independently verified for this indicator. Check the creator’s current publication and settings.
General descriptions and classifications are recovered research. Verified details above identify the specific checks we have completed. Check the creator’s current publication for later changes.