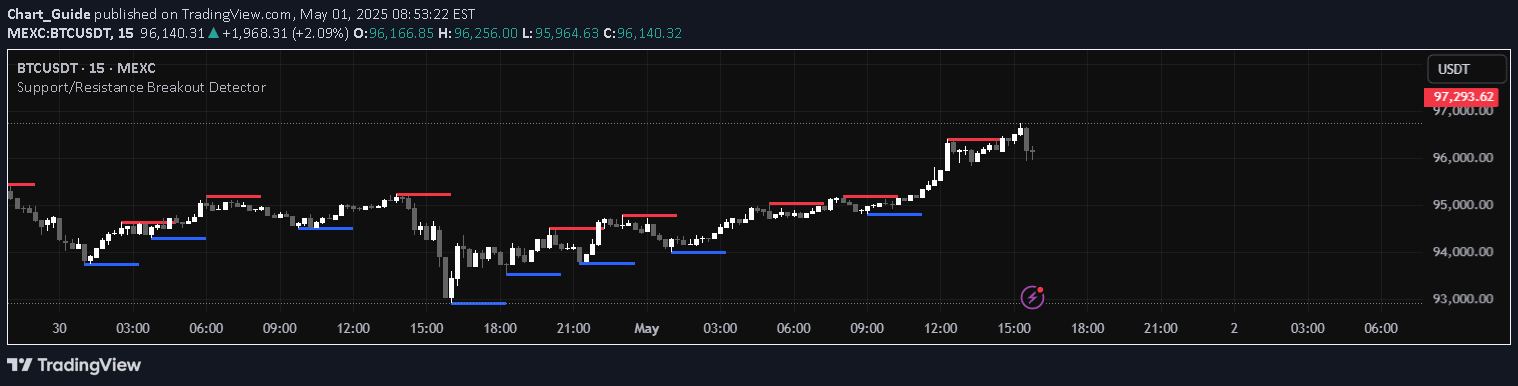
A histogram-based indicator that visualizes price volatility by measuring the range between high and low prices, helping traders understand market dynamics and potential price movements.
Explore complementary indicator rolesHow it works
The Candle Range Histogram Indicator calculates the price range of each candle by subtracting the low price from the high price, creating a visual representation of market volatility. It generates a histogram that displays these ranges, with the height of each bar corresponding to the magnitude of price movement during that specific time period.
The indicator automatically plots these ranges on a separate panel beneath the main price chart, allowing traders to quickly assess the relative volatility of different market periods. By comparing the histogram bars, traders can identify periods of increased or decreased price fluctuation, which can provide insights into potential market behavior and trading opportunities.
Why it may be useful
Market volatility is a critical factor in trading, and understanding price range dynamics can help traders make more informed decisions about potential entry and exit points. By providing a clear visual representation of price movement, the Candle Range Histogram allows traders to quickly identify periods of heightened market activity and potential trend changes.
The indicator serves as a valuable tool for risk management, helping traders assess market conditions and adjust their strategies accordingly. By offering insights into price volatility, traders can better gauge potential market movements, set more accurate stop-loss and take-profit levels, and develop more robust trading approaches.
When to explore it
The Candle Range Histogram is most effective during periods of changing market conditions, particularly when traders want to assess intraday volatility and potential trend strength. It can be especially useful during news events, earnings releases, or other periods where significant price movements are likely to occur.
Traders should use this indicator in conjunction with other technical analysis tools to confirm signals and validate potential trading opportunities. It is particularly valuable for day traders and scalpers who rely on short-term price movements and need to quickly assess market volatility to make rapid trading decisions.
Keep exploring
What we’ve verified
Access, alerts and repainting behaviour have not been independently verified for this indicator. Check the creator’s current publication and settings.
General descriptions and classifications are recovered research. Verified details above identify the specific checks we have completed. Check the creator’s current publication for later changes.