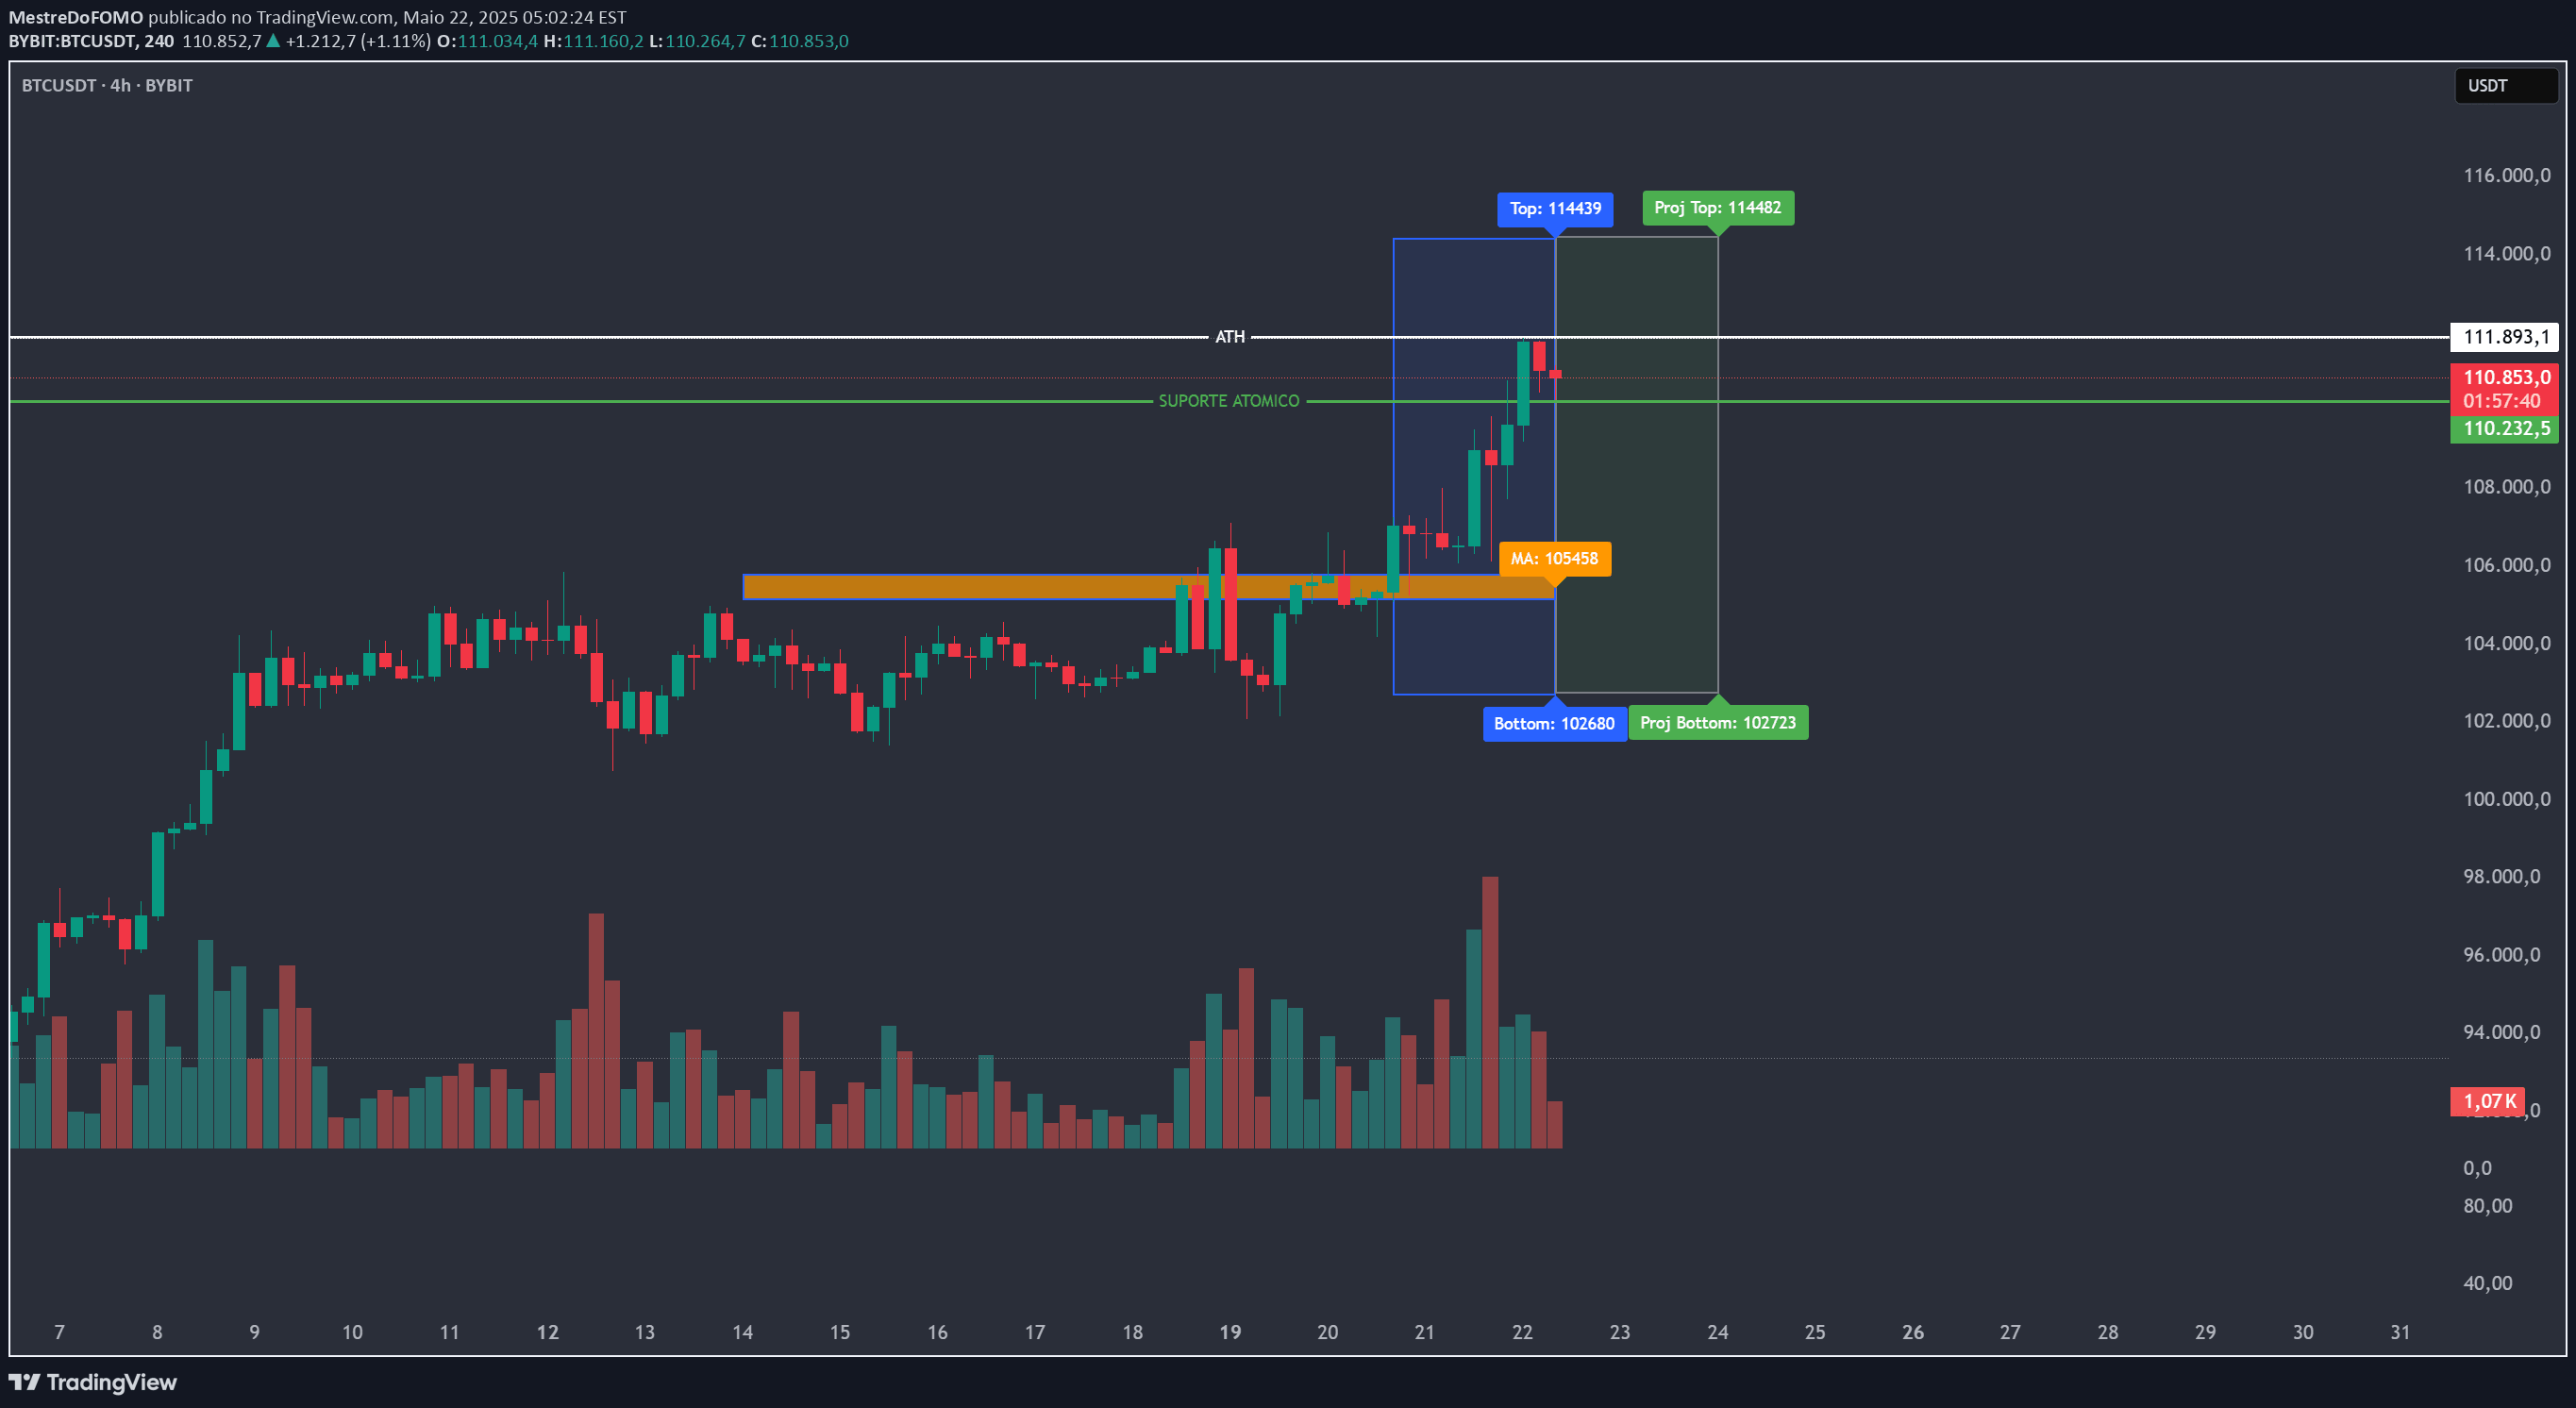
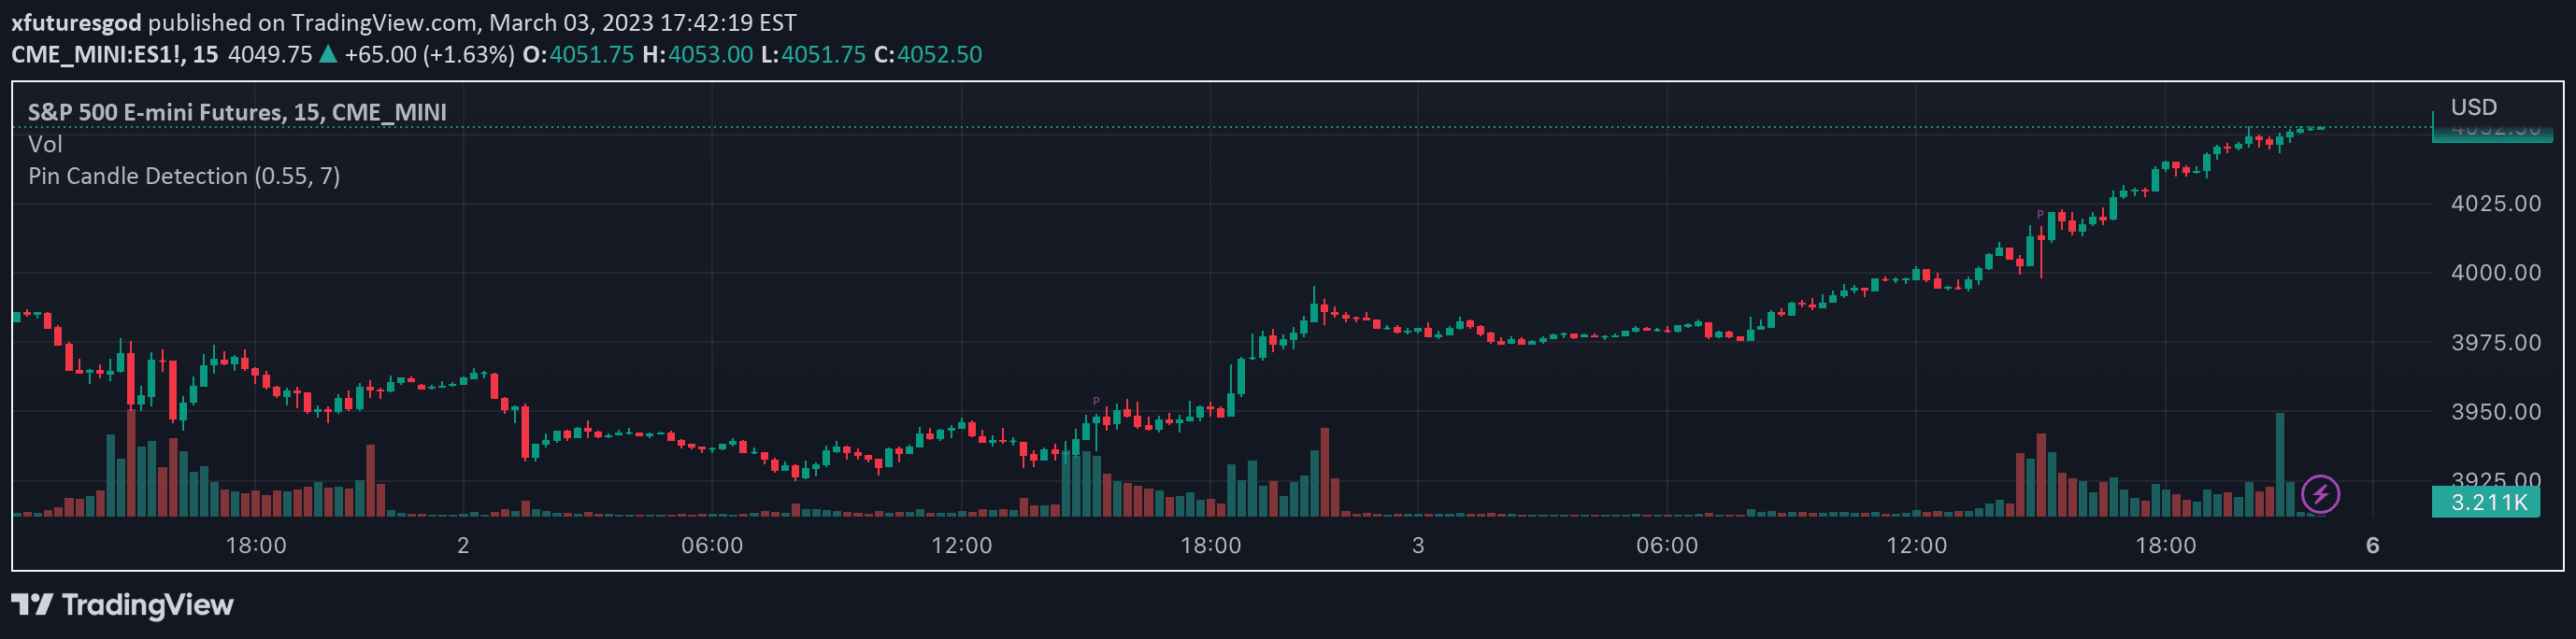
A custom TradingView indicator that detects potential trend reversals by analyzing candlestick colors and price movements around a calculated midpoint.
Explore complementary indicator rolesHow it works
The CCPD Candle Color Price Detector works by first calculating the highest high and lowest low over a specified number of bars. It then determines the midpoint between these extreme values, creating a central reference point for price analysis. The indicator tracks the color of each candlestick, differentiating between bullish (green) and bearish (red) price movements.
When a green candle closes above the midpoint, it generates a buy signal, suggesting potential bullish momentum. Conversely, when a red candle closes below the midpoint, it triggers a sell signal, indicating possible bearish pressure. This method allows traders to identify potential trend reversals by observing how price interacts with the central reference point.
Why it may be useful
The CCPD Candle Color Price Detector provides traders with a systematic approach to identifying potential market turning points. By focusing on candlestick color changes and their relationship to a calculated midpoint, the indicator offers insights into market sentiment and potential trend shifts. This approach helps traders make more informed decisions by providing clear visual and algorithmic signals.
Moreover, the indicator serves as a valuable confirmation tool when used alongside other technical analysis methods. It helps traders validate potential entry and exit points, reduce emotional trading, and develop a more structured approach to market analysis. The ability to customize the number of bars for calculations makes it adaptable to various trading styles and market conditions.
When to explore it
The CCPD Candle Color Price Detector is most effective in markets with clear trending or ranging characteristics. It works particularly well in timeframes that allow for clear candlestick formations, such as 5-minute, 15-minute, or hourly charts. Traders can benefit most from this indicator in markets with sufficient volatility to generate meaningful signals.
The indicator is especially useful during periods of potential trend reversal or when seeking confirmation of existing market movements. It can be particularly powerful when combined with other technical indicators, support and resistance levels, or volume analysis. Traders should exercise caution and use additional confirmation methods, as no single indicator can guarantee successful trades in all market conditions.
Keep exploring
What we’ve verified
Access, alerts and repainting behaviour have not been independently verified for this indicator. Check the creator’s current publication and settings.
General descriptions and classifications are recovered research. Verified details above identify the specific checks we have completed. Check the creator’s current publication for later changes.