Pin candles are technical analysis indicators tracking specific candle formations with significant wick lengths for potential market entry points, particularly useful in futures trading.
Explore complementary indicator rolesHow it works
Pin candles are identified by specific characteristics involving the candle's wick length and close position relative to Fibonacci retracement levels. Traders look for candles with substantial lower or upper wicks that close within a predetermined retracement zone, typically between 0.33 and 0.55 levels.
The script examines each candle's structure, measuring the wick's significance against predefined point thresholds specific to the traded instrument. By analyzing these precise candle formations, traders can identify potential entry points and market sentiment shifts with greater accuracy.
Why it may be useful
Pin candles provide traders with nuanced insights into market psychology and potential trend reversals by highlighting moments of price rejection and trader sentiment. They offer a more refined approach compared to traditional hammer candles, allowing for more precise technical analysis and entry point identification.
By incorporating volume profile studies and support levels, pin candles become even more powerful, helping traders make more informed decisions about market direction and potential trade opportunities.
When to explore it
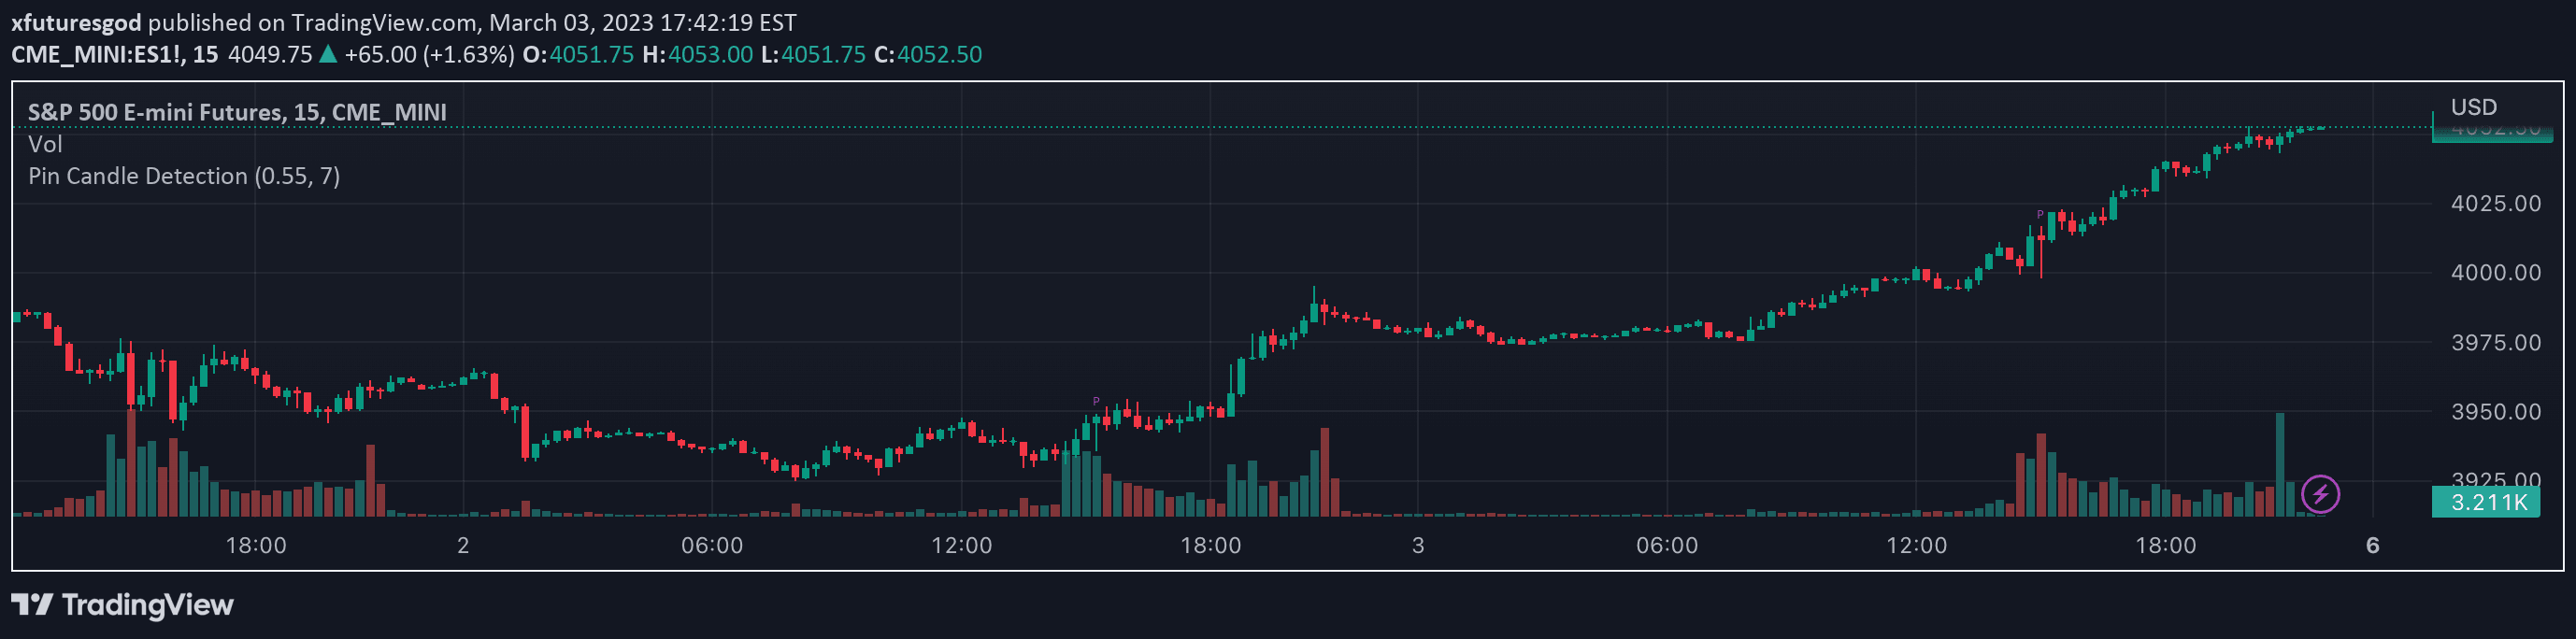
Pin candles are most effective in futures markets with clear, measurable price movements, such as ES futures on 15-minute charts. They work best in markets with consistent volatility and when combined with additional technical analysis tools like volume profiles and support/resistance levels.
Traders should use pin candles when seeking high-probability entry points, particularly during periods of potential trend reversal or consolidation. They are especially useful for traders looking to capture short-term price movements with precise risk management strategies.
Keep exploring
What we’ve verified
Access, alerts and repainting behaviour have not been independently verified for this indicator. Check the creator’s current publication and settings.
General descriptions and classifications are recovered research. Verified details above identify the specific checks we have completed. Check the creator’s current publication for later changes.