A trading indicator designed to identify bull flag patterns in futures markets, helping traders recognize potential long entry points during upward price movements.
Explore complementary indicator rolesHow it works
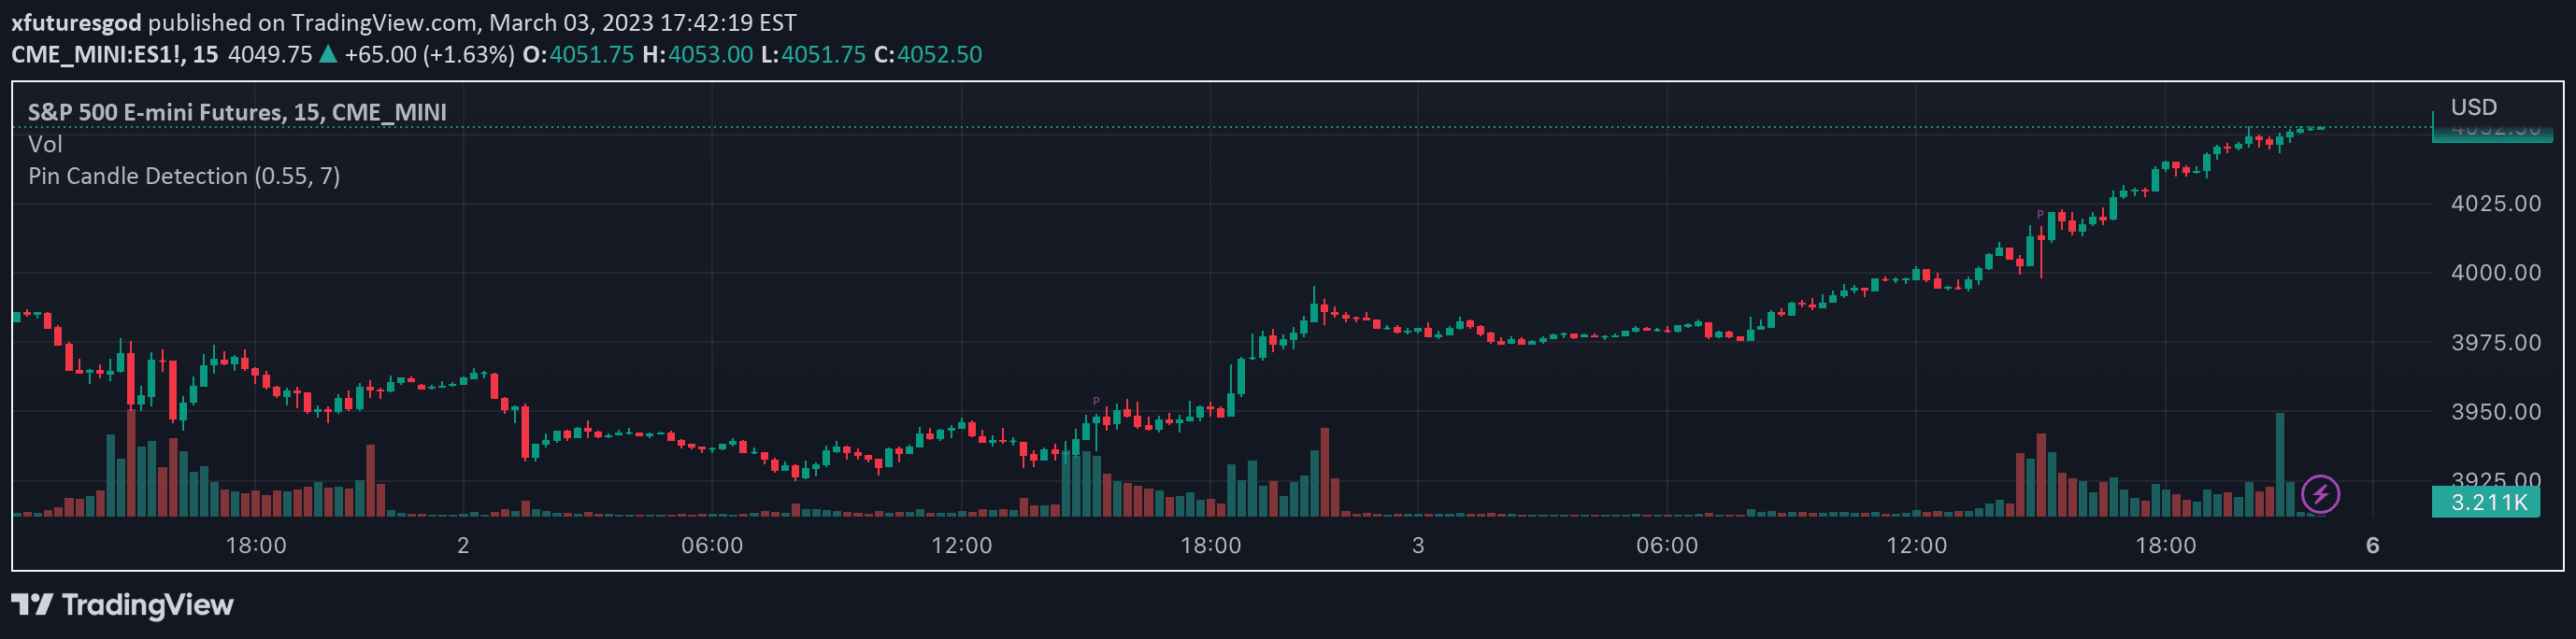
The FuturesGod bull flag indicator operates by first identifying a flag pole through a user-defined lookback period and percentage threshold. It tracks significant price movements that meet these criteria and marks the pole with a downward off-white triangle.
After detecting the pole, the indicator creates a visual representation of the consolidation area using swing highs and swing lows. It additionally plots 20, 50, and 200 period exponential moving averages, with the area between the 20 and 50 EMAs shaded to highlight a potential support zone.
Why it may be useful
Bull flag patterns are crucial for traders seeking to capitalize on momentum-driven market movements. By identifying these patterns, traders can recognize potential continuation signals that suggest an asset's price is likely to resume its previous upward trend after a brief consolidation period.
The visual elements of this indicator, such as the shaded green consolidation area and EMA support zone, provide traders with clear, intuitive insights into market dynamics. These visual cues help traders make more informed decisions about potential entry and exit points.
When to explore it
This indicator is most effective in futures markets, particularly for intraday trading on instruments like NQ and ES. It works best in trending markets where prices are showing clear upward momentum and experiencing periodic consolidation phases.
Traders should utilize this indicator when seeking to identify potential long entry points during an upward price trend. It is particularly useful in markets with sufficient volatility and clear directional movement, allowing traders to spot and potentially exploit bull flag formations.
Keep exploring
What we’ve verified
Access, alerts and repainting behaviour have not been independently verified for this indicator. Check the creator’s current publication and settings.
General descriptions and classifications are recovered research. Verified details above identify the specific checks we have completed. Check the creator’s current publication for later changes.