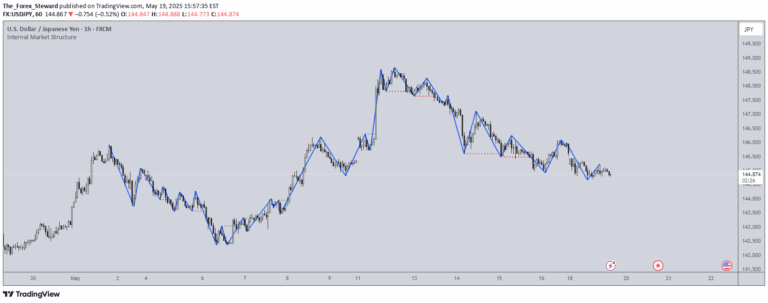
An advanced indicator that identifies inside bar patterns, detecting breakouts and fakeouts with three distinct scenarios to help traders recognize potential market movement opportunities.
Explore complementary indicator rolesHow it works
The indicator first detects inside bar patterns by analyzing consecutive candlesticks and filtering them based on predefined parameters. It then applies sophisticated algorithms to identify potential breakouts and fakeouts by examining the relationship between these inside bars and subsequent price movements.
The system calculates moving averages to determine trend direction and uses three specific scenario detection methods. These scenarios include strong breakouts with reversals, weak breakouts with multiple doji candles, and strong breakouts without reversal, providing traders with comprehensive market behavior analysis.
Why it may be useful
This indicator provides traders with a nuanced approach to understanding market dynamics by combining multiple technical analysis concepts into a single, powerful tool. By detecting complex candlestick patterns and breakout scenarios, it helps traders make more informed decisions about potential entry and exit points.
The multi-scenario approach allows traders to differentiate between strong and weak market movements, reducing the risk of false signals. Its flexible visualization and alert conditions enable traders to adapt the indicator to their specific trading style and risk tolerance, making it a valuable asset for technical analysis.
When to explore it
The inside bar breakout indicator is most effective in markets with clear price action and defined trend movements, such as forex, stocks, and futures markets. It performs best in timeframes that allow for detailed candlestick analysis, ranging from short-term scalping to longer-term swing trading scenarios.
Traders should use this indicator when they want to identify potential trend reversals, breakouts, and market momentum shifts. It is particularly useful during periods of market consolidation or when price is trading within a tight range, helping traders anticipate potential future price movements and make more strategic trading decisions.
Keep exploring
What we’ve verified
Access, alerts and repainting behaviour have not been independently verified for this indicator. Check the creator’s current publication and settings.
General descriptions and classifications are recovered research. Verified details above identify the specific checks we have completed. Check the creator’s current publication for later changes.