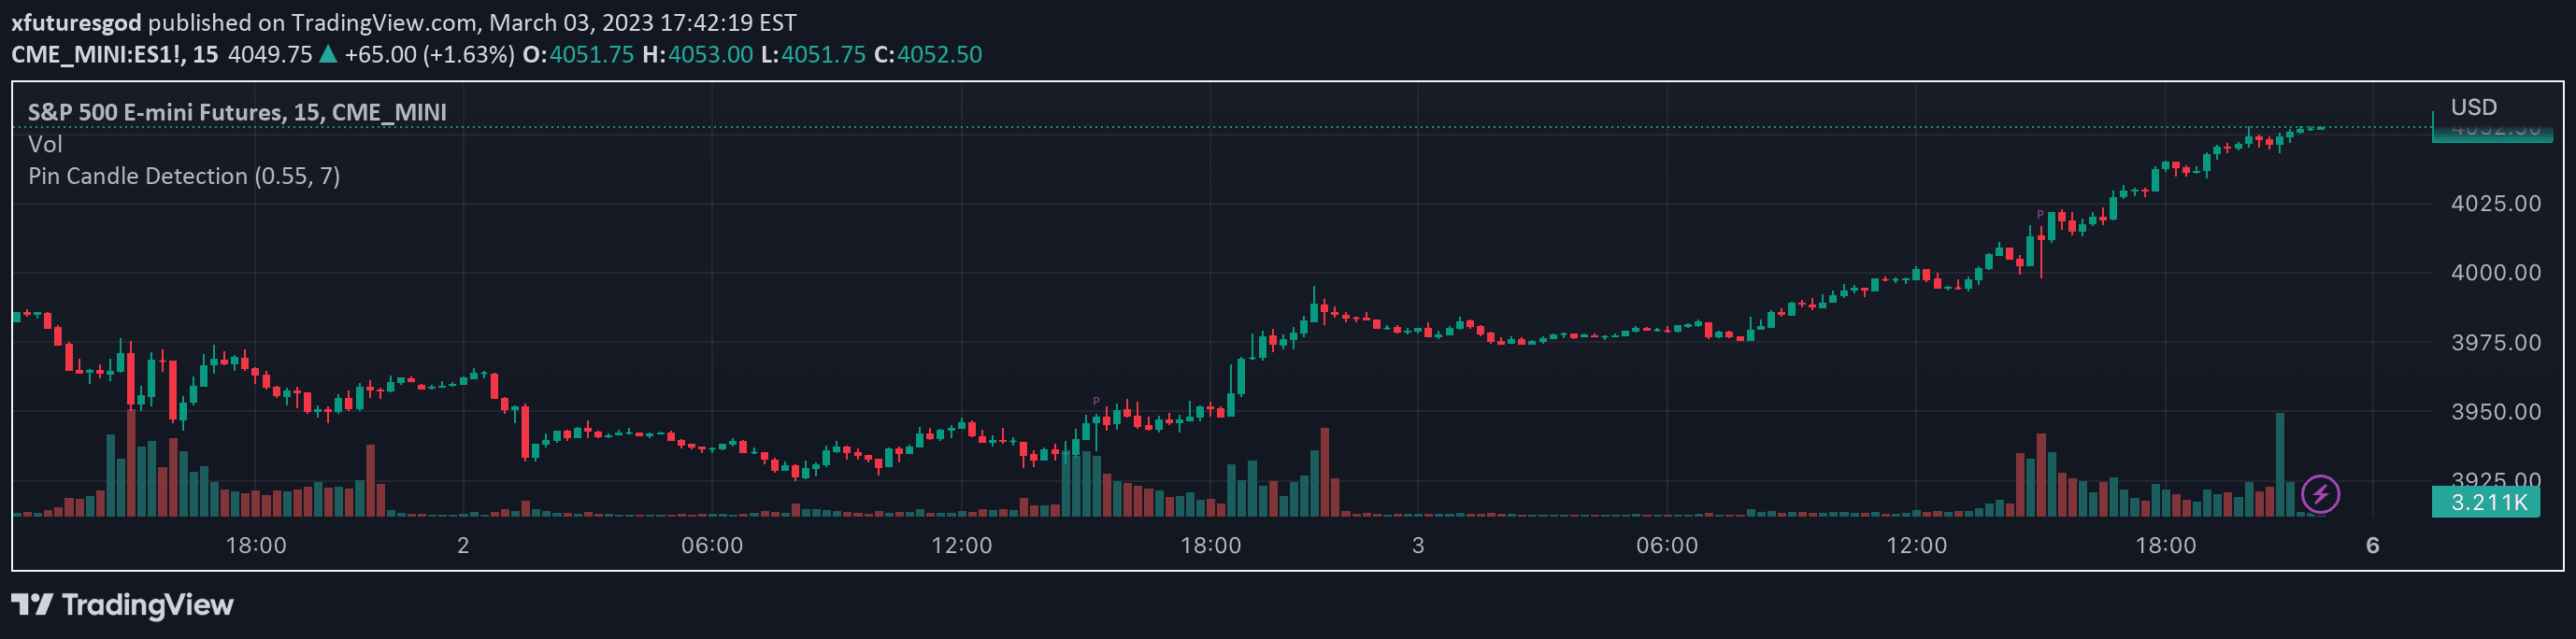
A candlestick pattern recognition tool that identifies Hammer and Inverted Hammer signals, helping traders spot potential market reversals with customizable detection settings.
Explore complementary indicator rolesHow it works
The Hammer and Inverted Hammer indicator automatically scans price charts to detect specific candlestick patterns that suggest potential market reversals. It analyzes the length of candle tails, comparing them to the overall candle size and recent price action to identify these distinctive patterns.
The script uses configurable settings like minimum tail length percentages, number of consecutive candles, and price range comparisons to precisely define and detect Hammer (bullish reversal) and Inverted Hammer (bearish reversal) patterns. Traders can adjust these parameters to fine-tune the pattern recognition process according to their specific trading strategy and market conditions.
Why it may be useful
Candlestick patterns like Hammer and Inverted Hammer provide critical insights into potential market sentiment shifts and trend reversals. By identifying these patterns automatically, traders can quickly recognize moments when buying or selling pressure might be changing, potentially signaling an upcoming price movement.
The customizable nature of this indicator allows traders to adapt the pattern detection to different market environments, making it a versatile tool for understanding price action. By providing clear, objective criteria for pattern recognition, the script helps traders make more informed decisions and potentially improve their entry and exit timing.
When to explore it
The Hammer and Inverted Hammer indicator works best in markets with clear price action and identifiable trend transitions. It is particularly useful in volatile markets where quick sentiment changes can create significant trading opportunities. Traders should focus on using this indicator in conjunction with other technical analysis tools to confirm potential signals.
The indicator is most effective when applied to timeframes that allow for meaningful candlestick formation, such as daily, 4-hour, or 1-hour charts. Traders should be cautious and use additional confirmation methods, as no single indicator can guarantee market direction with absolute certainty.
Keep exploring
What we’ve verified
Access, alerts and repainting behaviour have not been independently verified for this indicator. Check the creator’s current publication and settings.
General descriptions and classifications are recovered research. Verified details above identify the specific checks we have completed. Check the creator’s current publication for later changes.