
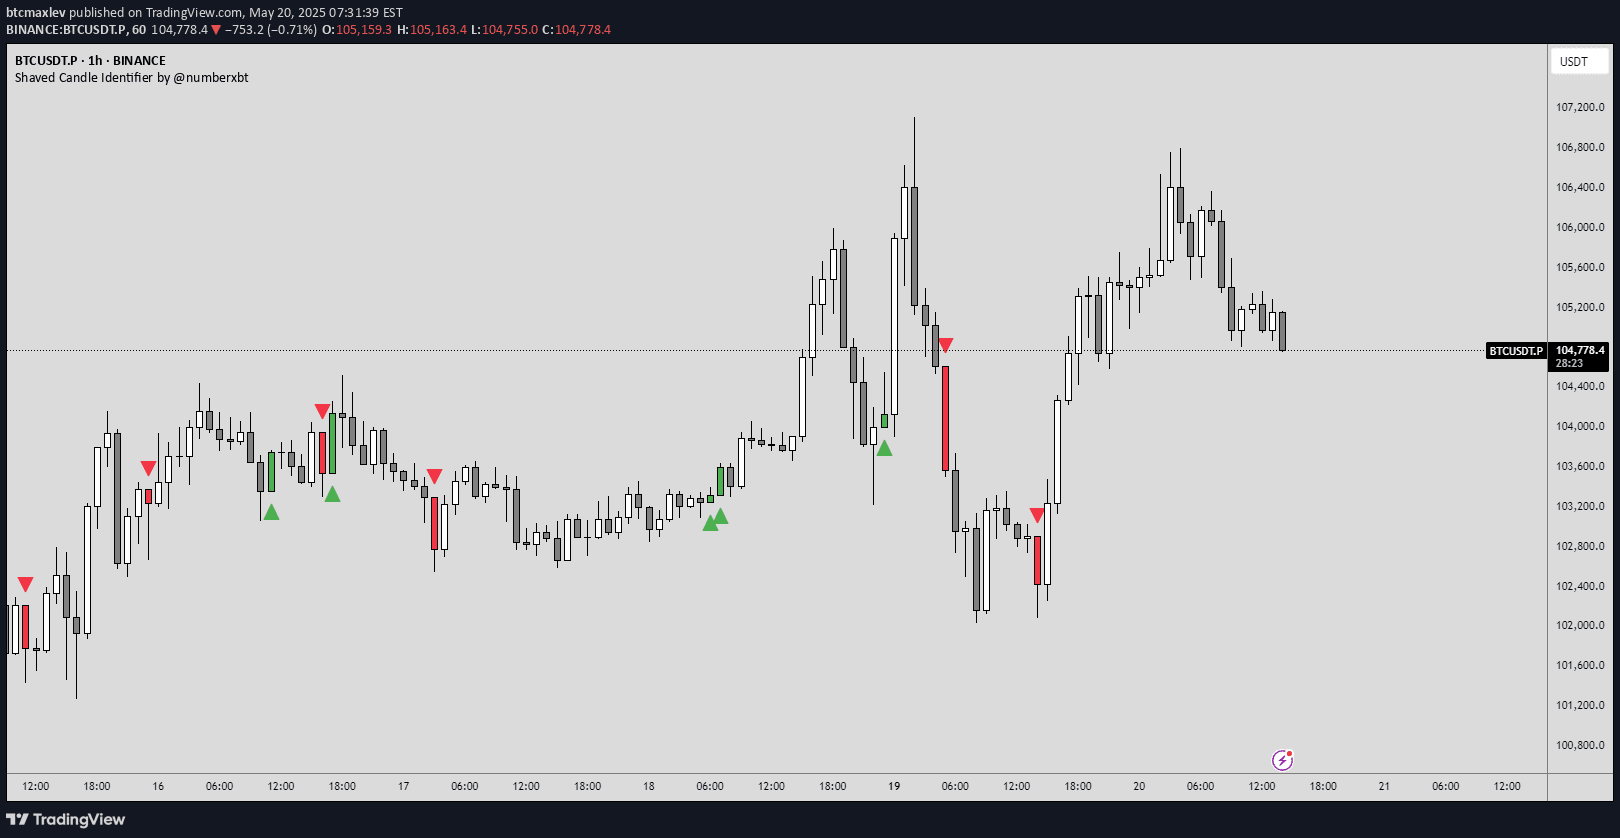
A specialized candle highlighting script that identifies shaved candles with different colors, revealing potential liquidity zones and price reversal points in trading charts.
Explore complementary indicator rolesHow it works
The script analyzes each price candle by examining its open, close, high, and low values with absolute precision. It identifies specific shaved candle patterns where either the open or close price matches exactly with the high or low price.
Each unique shaved candle configuration is represented by a different color: green when open equals low, red when open equals high, blue when close equals high, and orange when close equals low. The script applies a zero-tolerance approach, meaning only perfectly shaved candles are recognized
Why it may be useful
Shaved candles provide crucial insights into market liquidity and potential price movements. They help traders identify key areas where significant price action might occur in the future.
By highlighting these specific candle formations, traders can better understand market sentiment, potential reversal points, and areas of concentrated trading interest. These visual indicators offer a unique perspective on market dynamics that standard candlestick patterns might not reveal as clearly
When to explore it
This indicator works best in markets with clear trending behavior and significant liquidity zones. Traders should use it when seeking to identify potential reversal points or areas of price consolidation.
It is particularly useful in volatile markets where precise entry and exit points are critical. The indicator is most effective when combined with other technical analysis tools and when applied to timeframes that allow for clear candle pattern recognition
Keep exploring
What we’ve verified
Access, alerts and repainting behaviour have not been independently verified for this indicator. Check the creator’s current publication and settings.
General descriptions and classifications are recovered research. Verified details above identify the specific checks we have completed. Check the creator’s current publication for later changes.


