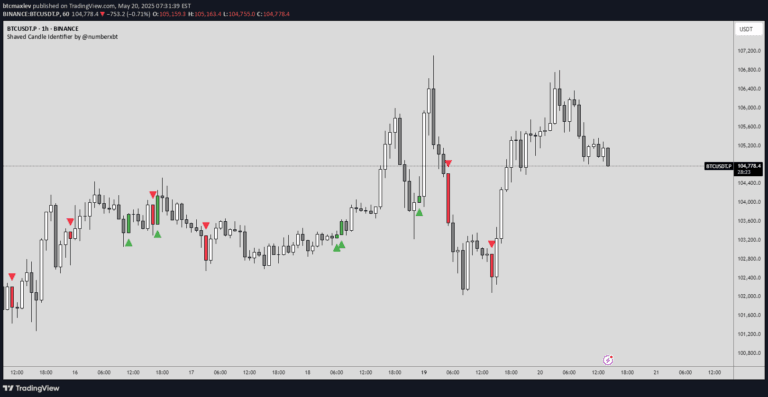
An hourly candlestick overlay script that dynamically renders price movements using green and red candles, providing real-time visual representation of market price changes across different timeframes.
Explore complementary indicator rolesHow it works
The script generates hourly candlesticks by capturing open, close, high, and low prices for each one-hour period. It utilizes TradingView's box and line functions to create visual candle representations.
Bullish candles are colored green, indicating price increases, while bearish candles are colored red, showing price declines. The script dynamically updates as new hourly candles form, adjusting box and wick positions in real-time. Each candle provides a comprehensive view of price movement within that specific hour
Why it may be useful
Hourly candlestick overlays provide traders with a granular view of price action, enabling more precise market analysis. They help identify short-term trend changes, momentum shifts, and potential entry or exit points.
By visualizing price movements in different colors, traders can quickly interpret market sentiment and understand price dynamics. These dynamic representations offer insights into market psychology, showing whether buyers or sellers are in control during each hourly period
When to explore it
This script is most effective for day traders and short-term investors seeking detailed market insights. It works best in liquid markets with consistent price movements, such as forex, major stock indices, and cryptocurrency pairs.
Traders can use it across multiple timeframes to confirm trend strength and potential reversals. It is particularly useful during active trading hours when market volatility is high. The script provides valuable context for making quick, informed trading decisions
Keep exploring
What we’ve verified
Access, alerts and repainting behaviour have not been independently verified for this indicator. Check the creator’s current publication and settings.
General descriptions and classifications are recovered research. Verified details above identify the specific checks we have completed. Check the creator’s current publication for later changes.