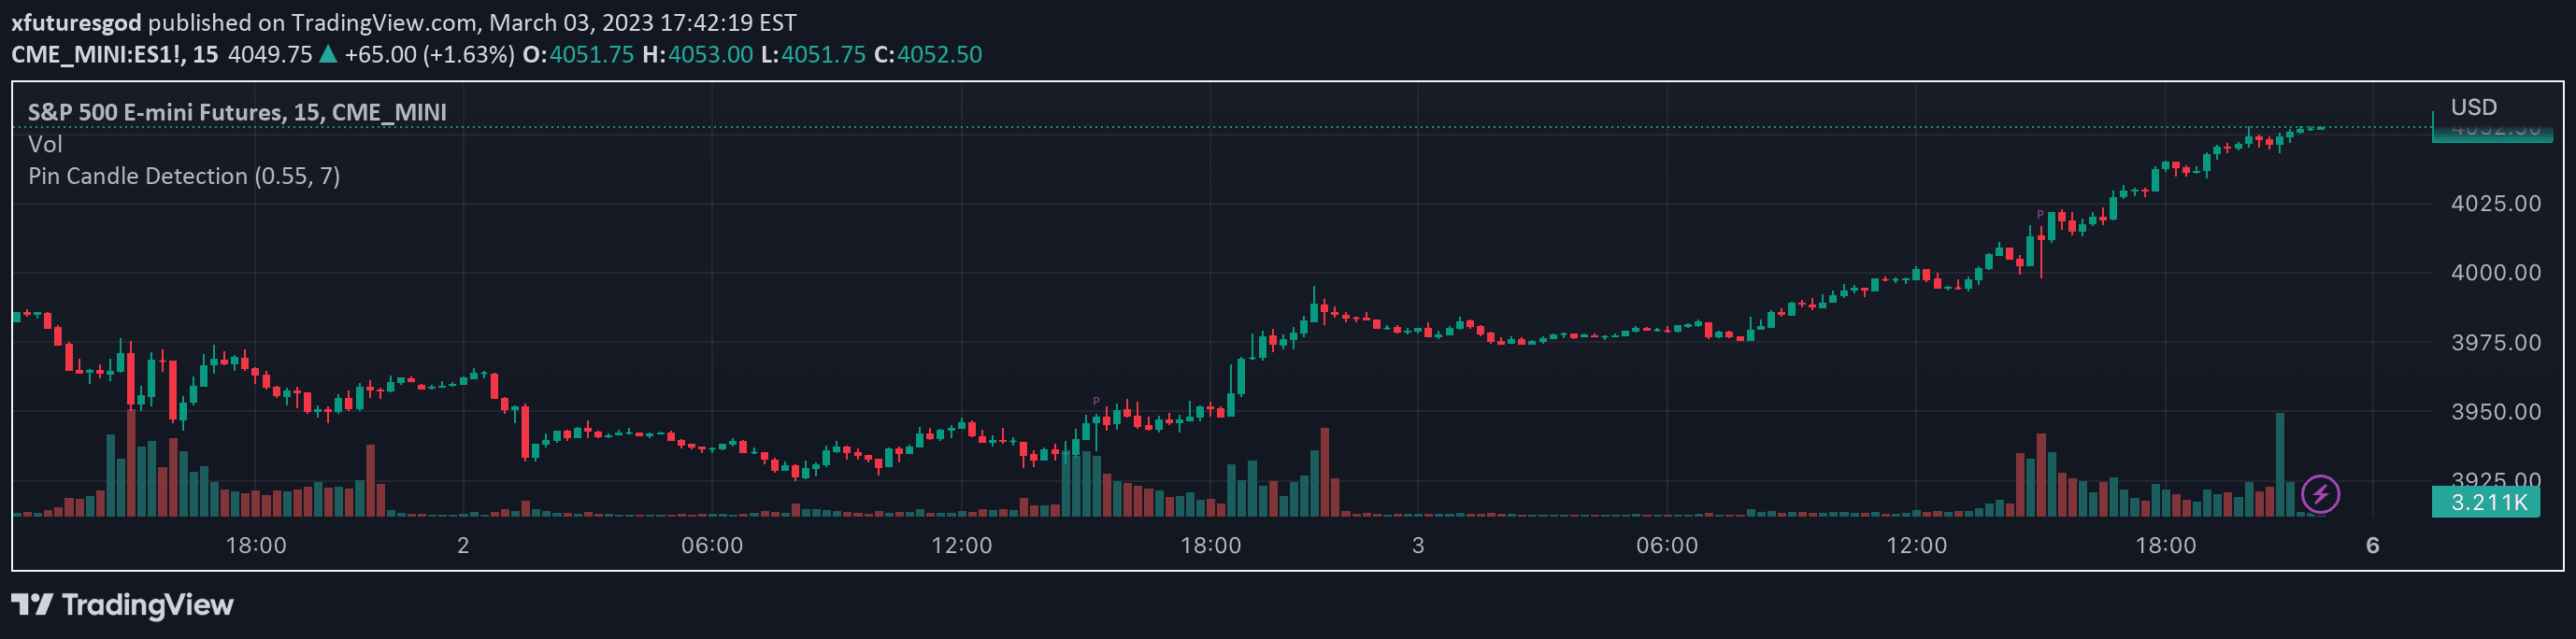
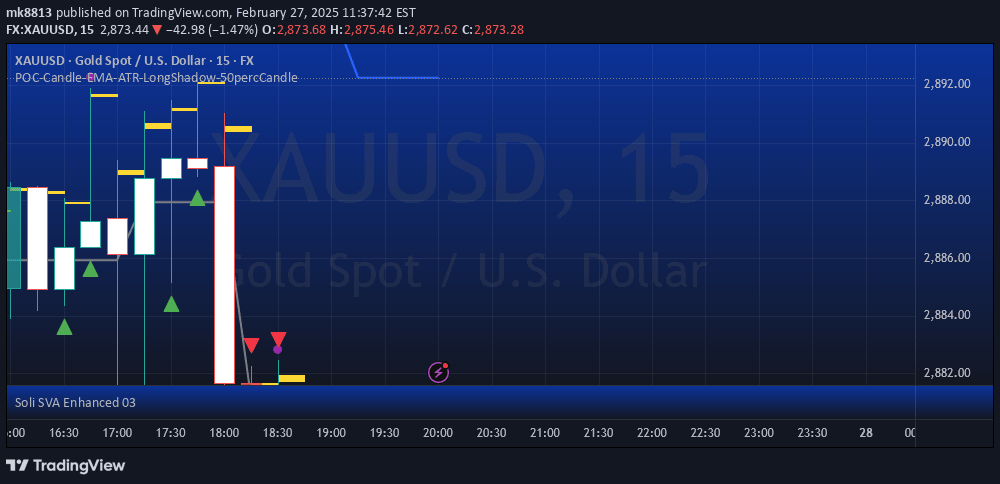
A specialized TradingView indicator that identifies Vortex Candles with no wicks, signaling potential price retracements or reversals using the Power of Three concept.
Explore complementary indicator rolesHow it works
The Vortex Candle Marker analyzes price candles to identify unique formations where the high or low equals either the open or close price, creating a wickless candle. By detecting these specific candle patterns, the indicator automatically changes the candle border color to aqua, highlighting potential significant price moments.
The core mechanism focuses on two primary conditions: a Vortex Top occurs when the high matches the open or close, while a Vortex Bottom happens when the low equals the open or close. This precise identification allows traders to quickly recognize candles with strong directional intent and potential market manipulation signals.
Why it may be useful
The Vortex Candle Marker provides traders with a sophisticated tool to detect subtle price action nuances that often go unnoticed in traditional charting methods. By highlighting wickless candles, the indicator helps traders identify potential liquidity grabs, stop-hunts, and market manipulation techniques that can signal imminent price reversals or continuations.
Understanding these unique candle formations enables traders to develop more advanced entry and exit strategies, particularly within the Power of Three (PO3) framework. The indicator offers insights into market psychology, revealing moments of strong directional intent and potential price reversion points that can significantly enhance trading decision-making.
When to explore it
The Vortex Candle Marker is most effective when applied to markets with high liquidity and significant price action, such as forex, indices, and major cryptocurrency pairs. Traders should focus on using this indicator during periods of active trading, particularly around key support and resistance levels where price manipulation is more likely to occur.
It works best when combined with other technical analysis tools and volume indicators to confirm potential trading signals. Ideal scenarios include identifying potential breakouts, detecting early reversal signals, and understanding market sentiment during volatile trading conditions.
Keep exploring
What we’ve verified
Access, alerts and repainting behaviour have not been independently verified for this indicator. Check the creator’s current publication and settings.
General descriptions and classifications are recovered research. Verified details above identify the specific checks we have completed. Check the creator’s current publication for later changes.