ICT Power Of Three | Flux Charts
An advanced trading indicator using ICT's Power Of Three strategy to detect smart money movements through accumulation, manipulation, and distribution phases.
Explore 11,183 indicators. Filter beyond the obvious.
Discover the tools that fit the way you trade.
11,183 tools to explore
An advanced trading indicator using ICT's Power Of Three strategy to detect smart money movements through accumulation, manipulation, and distribution phases.
A sophisticated trading strategy that uses market maker behavior and key metrics to identify potential trend reversals and strategic entry points across different market conditions.
A multi-timeframe analysis tool that projects higher timeframe candle information onto the current chart, enabling simultaneous visualization of different timeframe price movements and patterns.
A trading approach that divides the day into quarters and 90-minute cycles, analyzing market phases of Accumulation, Manipulation, Distribution, and Rebalance.
A liquidity-driven trading strategy focusing on market structure shifts, fair value gaps, and external liquidity levels to identify precise market entry points.
Range Separator is a visual trading tool that helps traders identify critical price levels and ranges by marking hourly and 15-minute intervals with customizable lines.
AMDX/XAMD indicator highlights specific trading sessions with customizable colors and styles, dividing the trading day into four distinct market phases for analysis.
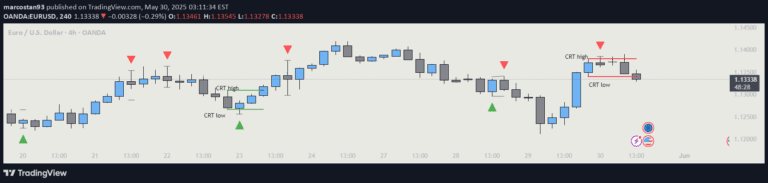
A trading strategy focusing on specific time frames and market sessions to identify high-probability entry points using CRT candles and session-based volatility analysis.
The Power of Three (PO3) indicator helps traders identify market manipulation and liquidity generation strategies across multiple timeframes by analyzing candle opens.
A trading indicator that identifies potential market reversals or continuations by analyzing two consecutive candle patterns and generating visual signals with triangular markers.
A trading strategy focusing on hourly candle opens, revealing market maker movements through accumulation, manipulation, and distribution phases.
An advanced trend detection indicator that combines dynamic G-Channels with RSI confirmation to help traders identify potential buy and sell opportunities across various financial markets.
Likes, views, and comments are historical TradingView snapshots. They describe attention, not trading performance.