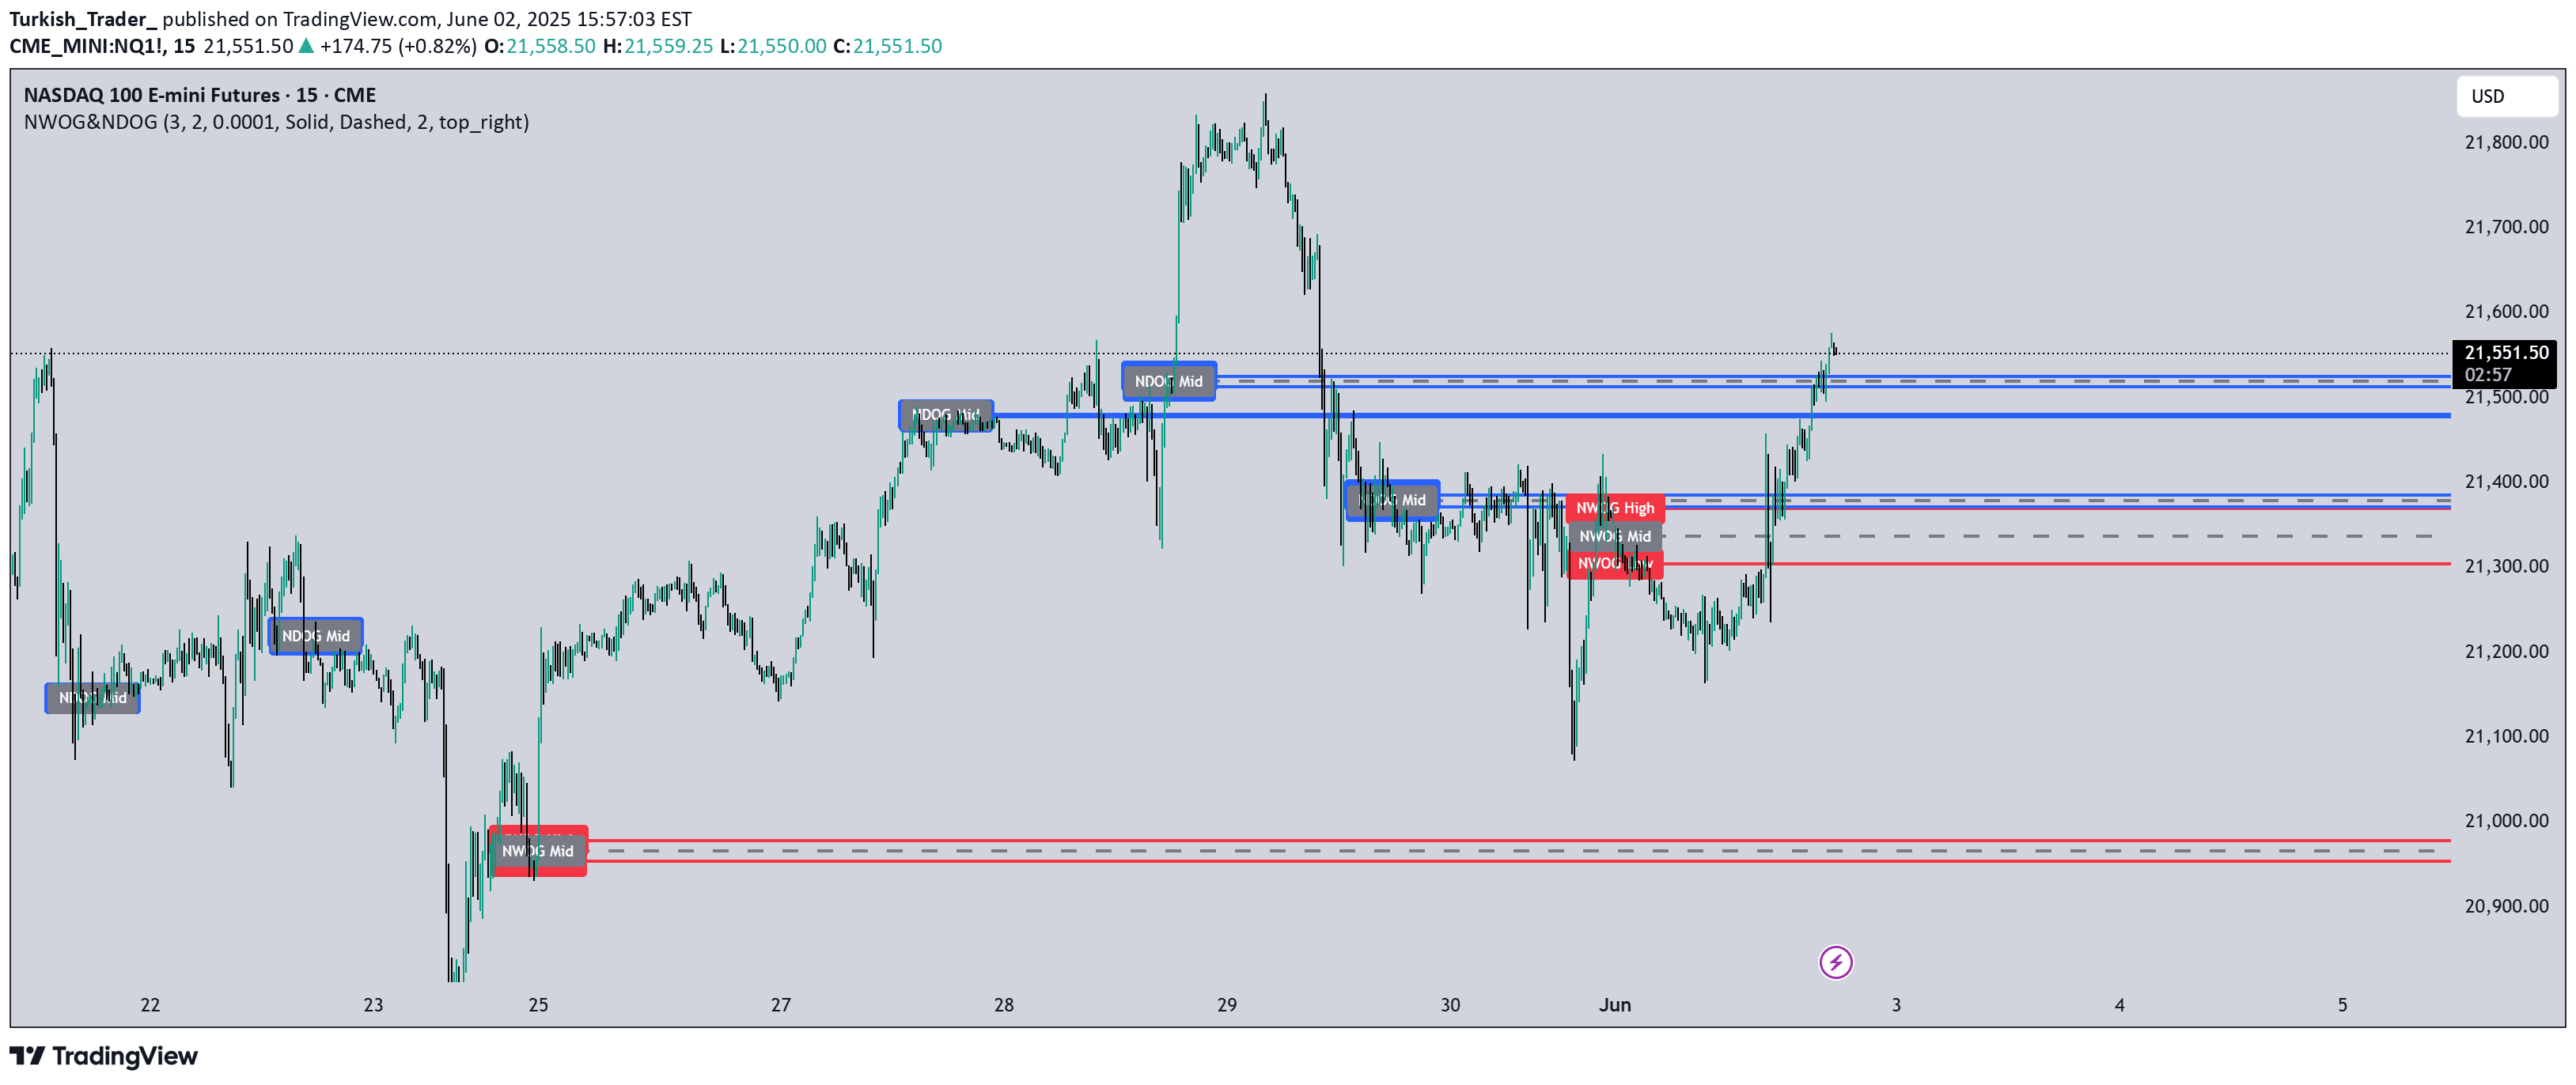
AMDX/XAMD indicator highlights specific trading sessions with customizable colors and styles, dividing the trading day into four distinct market phases for analysis.
Explore complementary indicator rolesHow it works
The AMDX/XAMD indicator segments the trading day into four distinct sessions: Accumulation (A), Manipulation (M), Distribution (D), and Continuation/Reversal (X). These sessions are calculated based on specific time ranges, with users able to choose between AMDX and XAMD session types, each with unique time allocations.
The indicator visually represents these sessions using either colored boxes or vertical lines, allowing traders to quickly identify and analyze different market phases. Users can customize the appearance by selecting individual colors for each session, adjusting transparency, and choosing between box or line drawing styles.
Why it may be useful
The AMDX/XAMD indicator provides traders with a structured approach to understanding market dynamics throughout different trading sessions. By breaking down the trading day into specific phases, it helps traders recognize potential market behaviors and transitions between accumulation, manipulation, distribution, and continuation or reversal periods.
This visual segmentation enables traders to develop more nuanced strategies by identifying potential market intentions and sentiment shifts. The customizable nature of the indicator allows for personalized analysis, making it a versatile tool for traders seeking to gain deeper insights into intraday market movements.
When to explore it
The AMDX/XAMD indicator is most effective for traders focusing on intraday and short-term trading strategies, particularly those interested in understanding market phase transitions. It works best in markets with clear session-based behaviors, such as forex, futures, and some stock indices that exhibit predictable daily patterns.
Traders can utilize this indicator during active trading hours to identify potential entry and exit points based on the different market phases. It is particularly useful for those who want to develop a more structured approach to analyzing market dynamics and making informed trading decisions throughout the day.
Keep exploring
What we’ve verified
Access, alerts and repainting behaviour have not been independently verified for this indicator. Check the creator’s current publication and settings.
General descriptions and classifications are recovered research. Verified details above identify the specific checks we have completed. Check the creator’s current publication for later changes.