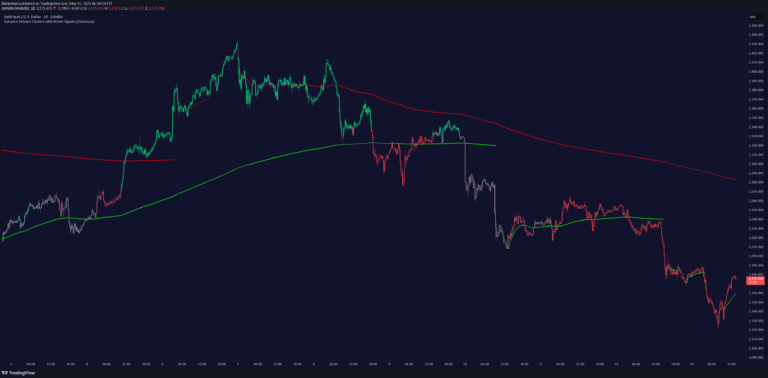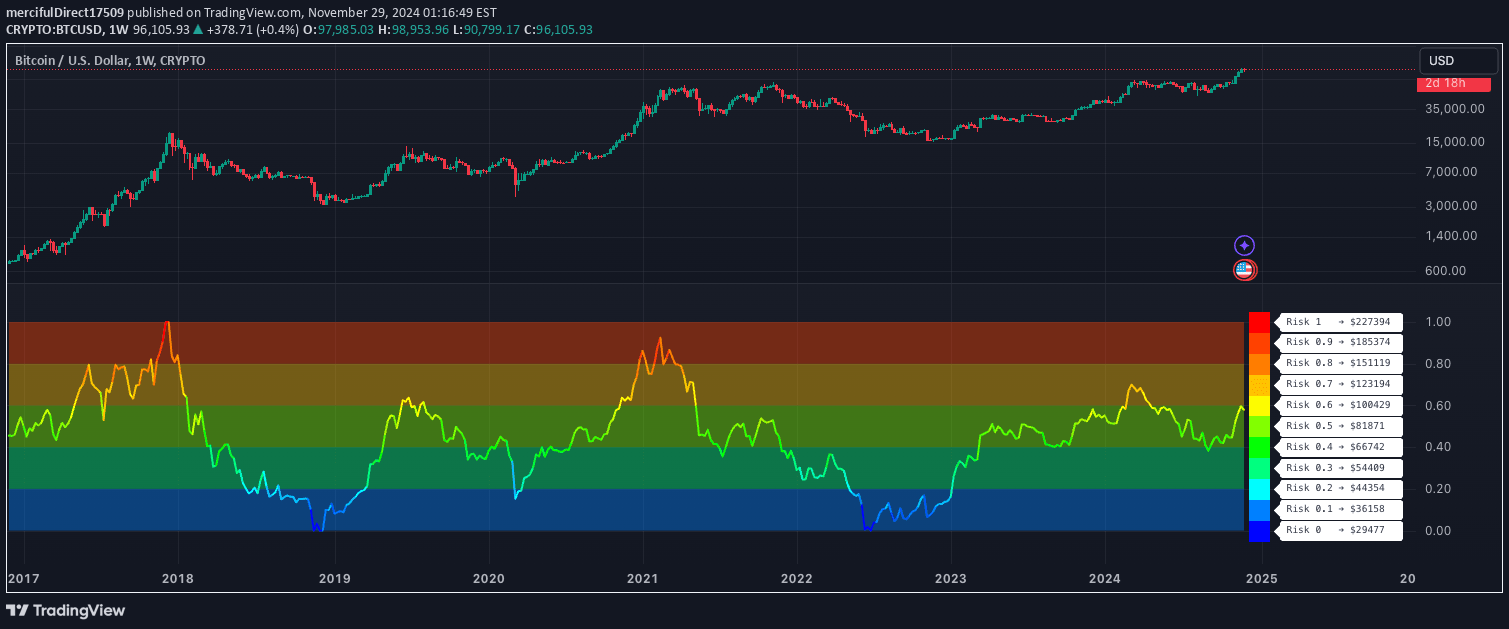
A dynamic risk analysis tool that uses price action and moving averages to provide normalized risk levels from 0-1, helping traders identify optimal entry and exit points.
Explore complementary indicator rolesHow it works
The risk indicator operates by analyzing price action and applying moving average calculations to generate a normalized risk scale from 0 to 1. It uses a sophisticated algorithm that incorporates dynamic ATH/ATL calculations and a power factor to adjust sensitivity to market conditions.
The indicator breaks down the risk scale into five distinct zones, each representing a different dollar-cost averaging (DCA) strategy. By color-coding these zones from blue to red, traders can quickly visualize potential buying and selling opportunities based on the current market risk level.
Why it may be useful
This risk indicator provides traders with a comprehensive visual tool for understanding market dynamics and potential entry/exit points. By normalizing risk into an easily digestible scale, it helps traders make more informed decisions about position sizing and market timing.
The multi-colored zone system allows traders to quickly assess market conditions without complex analysis, reducing emotional decision-making and providing a structured approach to trading strategy. Its customizable parameters enable adaptation to different trading styles and market environments.
When to explore it
The risk indicator is most effective in markets with clear trend movements and moderate to high volatility. It works best when combined with other technical analysis tools, providing an additional layer of insight into potential market opportunities.
Traders should use this indicator when seeking to optimize their entry and exit points, manage risk exposure, and develop a more systematic approach to trading. It is particularly useful for traders who want to implement a disciplined dollar-cost averaging strategy across different market conditions.
Keep exploring
What we’ve verified
Access, alerts and repainting behaviour have not been independently verified for this indicator. Check the creator’s current publication and settings.
General descriptions and classifications are recovered research. Verified details above identify the specific checks we have completed. Check the creator’s current publication for later changes.