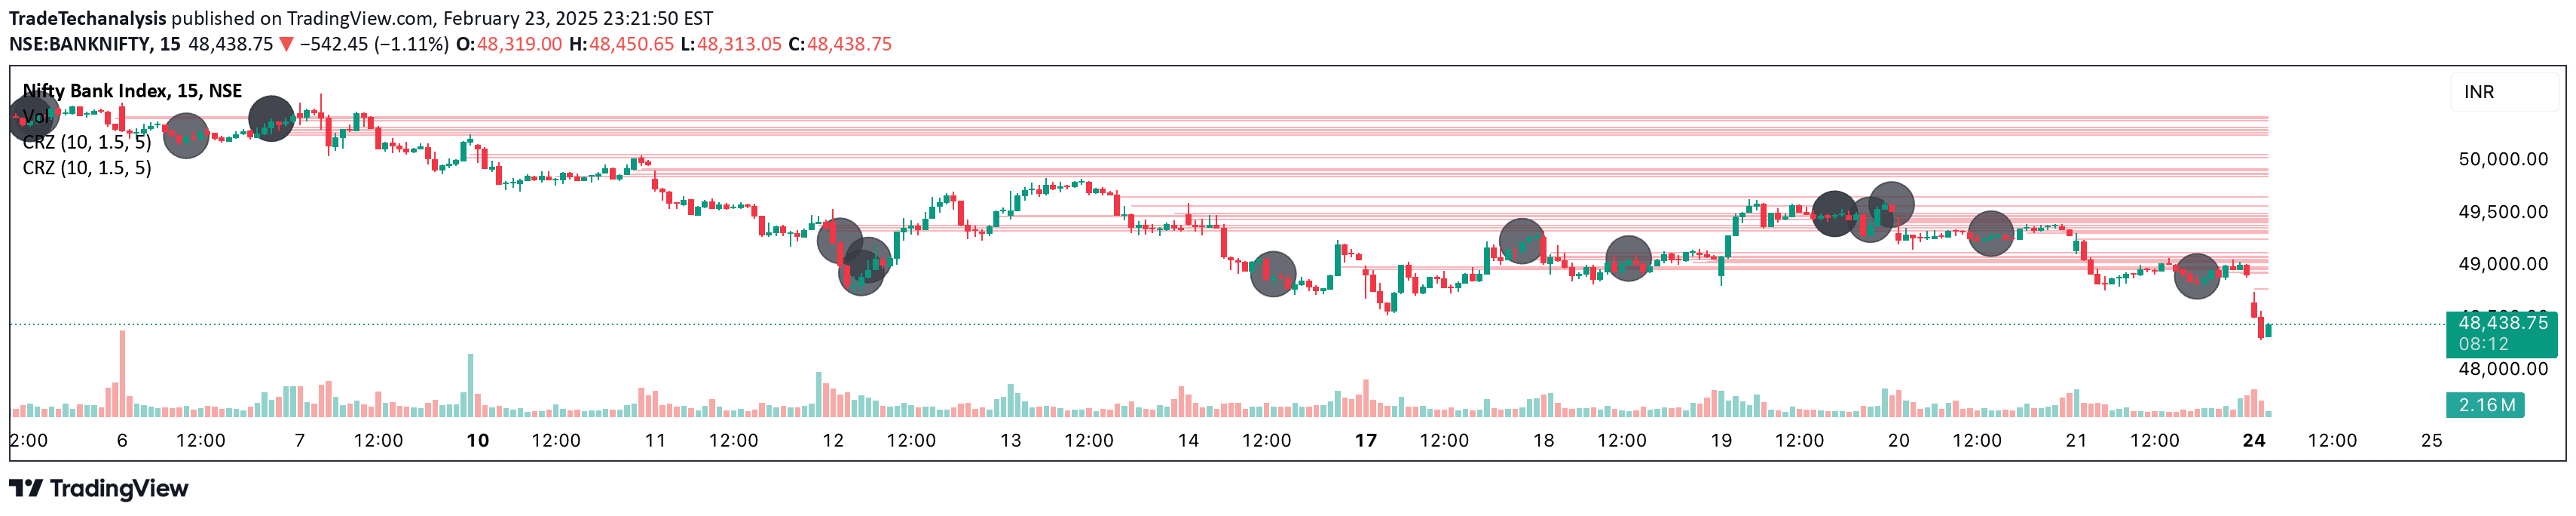
An advanced trading indicator using ICT's Power Of Three strategy to detect smart money movements through accumulation, manipulation, and distribution phases.
Explore complementary indicator rolesHow it works
The ICT Power Of Three Indicator identifies market phases through three key steps: accumulation, manipulation, and distribution. During accumulation, it detects price stability within a specific range by drawing lines from the lowest and highest points of recent bars and comparing them against the Average True Range.
In the manipulation phase, the indicator identifies when smart money creates liquidity by moving price against retail traders' expectations. Once manipulation is detected, the indicator automatically generates a shadow distribution zone in the opposite direction, providing potential trade entry points with predefined take-profit and stop-loss levels.
Why it may be useful
This indicator offers traders unique insights into smart money movements by revealing hidden market dynamics typically invisible to retail traders. By tracking accumulation, manipulation, and distribution phases, traders can align their strategies with institutional trading patterns and potentially gain a competitive edge.
The tool's ability to detect subtle market manipulations helps traders understand price action more deeply, transforming seemingly random market movements into strategic opportunities for more informed trading decisions.
When to explore it
The ICT Power Of Three Indicator is most effective in markets with clear institutional influence, such as forex, futures, and highly liquid stocks. It performs best when price action shows distinct ranging and trending characteristics, making it particularly suitable for traders who want to understand market structure beyond simple technical analysis.
Traders should use this indicator when seeking to identify potential trend reversals, breakout opportunities, and smart money positioning. It is especially valuable for those interested in understanding the psychological aspects of market movements and the strategic behaviors of large financial institutions.
Keep exploring
What we’ve verified
Access, alerts and repainting behaviour have not been independently verified for this indicator. Check the creator’s current publication and settings.
General descriptions and classifications are recovered research. Verified details above identify the specific checks we have completed. Check the creator’s current publication for later changes.