ICT Macros [LuxAlgo]
An advanced trading indicator that identifies specific market timing intervals where algorithmic trading creates or interacts with liquidity at predetermined times.
Explore 11,183 indicators. Filter beyond the obvious.
Discover the tools that fit the way you trade.
11,183 tools to explore
An advanced trading indicator that identifies specific market timing intervals where algorithmic trading creates or interacts with liquidity at predetermined times.
An advanced trading indicator using ICT's Power Of Three strategy to detect smart money movements through accumulation, manipulation, and distribution phases.
A time-based trading indicator dividing the market day into three phases: Accumulation, Manipulation, and Distribution, helping traders understand institutional trading strategies.
A trading tool that uses Interbank Price Delivery Algorithm to identify time windows and standard deviations across multiple timeframes for potential price movement prediction.
Liquidity Concepts indicator identifies potential stop-loss zones and market structure using pivot points to help traders detect liquidity grabs and stop-loss hunts.
A comprehensive trading indicator that combines multiple market analysis techniques including liquidity sweeps, fair value gaps, market structure shifts, and trading sessions for precise market entry and exit points.
An advanced trading strategy using ICT principles to identify high-probability trade setups by analyzing market manipulation, liquidity traps, and institutional order flow during specific market sessions.
A trading strategy analyzing Smart Money market manipulation by identifying order blocks and pivots to help traders understand and align with institutional trading patterns.
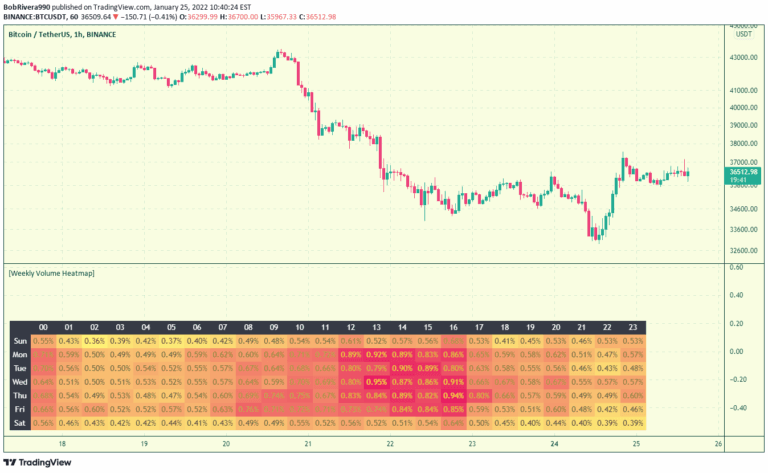
A trading tool that visualizes asset trading volume variations across different times of the week, helping traders understand market liquidity and optimal trading periods.
A trading approach that divides the day into quarters and 90-minute cycles, analyzing market phases of Accumulation, Manipulation, Distribution, and Rebalance.
SMT Divergence identifies potential market reversals by comparing price behaviors between two correlated assets, revealing subtle signs of market manipulation and trend shifts.
AMDX strategy divides the trading day into four distinct phases, providing a structured approach to understanding market behavior and institutional trading patterns.
Likes, views, and comments are historical TradingView snapshots. They describe attention, not trading performance.