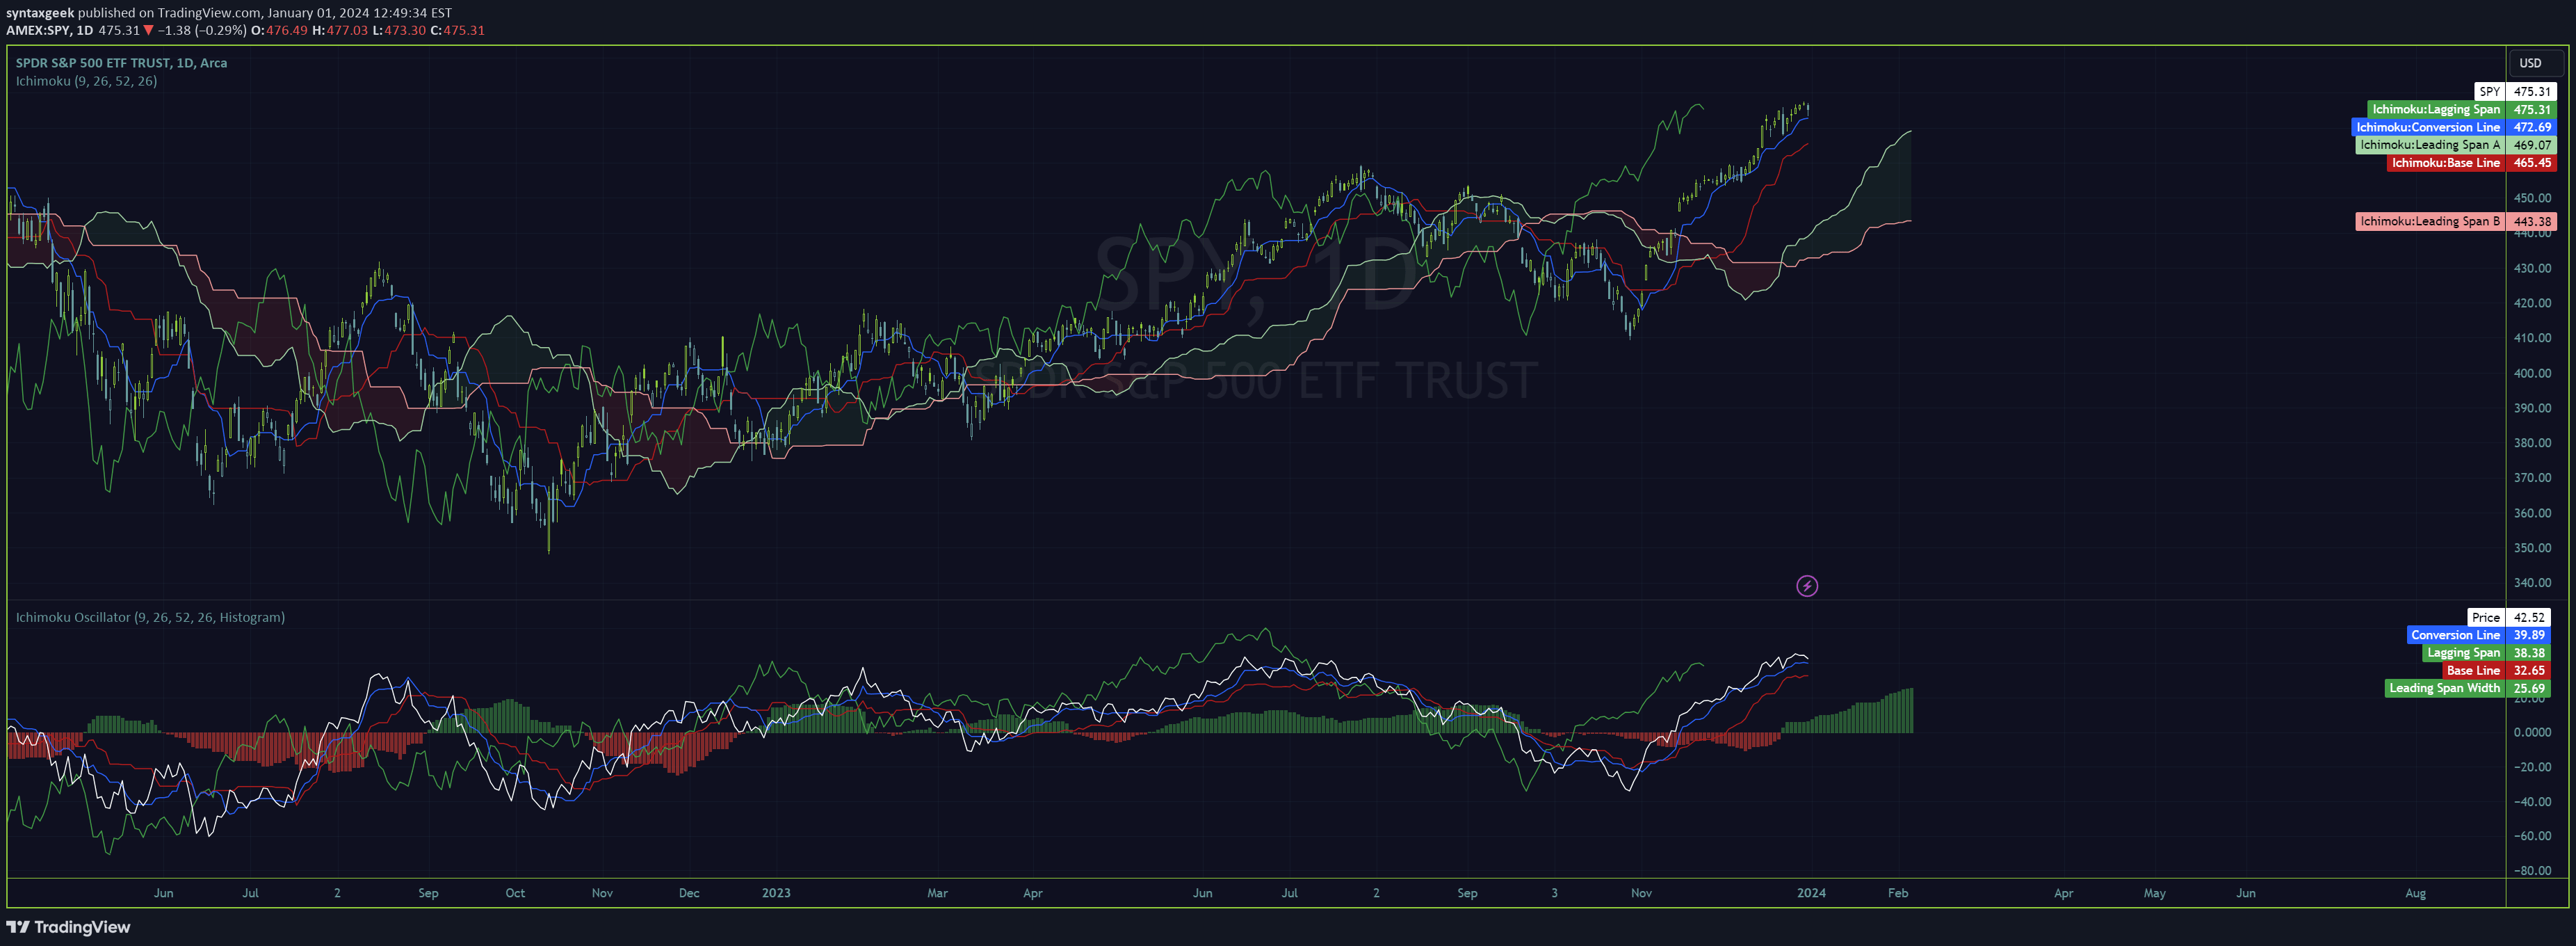
A Chaikin-based oscillator that measures buying and selling pressure by comparing smoothed averages of the Accumulation/Distribution line to identify market trends.
Explore complementary indicator rolesHow it works
The Chaikin-Bull-PW Indicator calculates the Accumulation/Distribution (AD) line and applies two different smoothing methods to create a short-period and long-period average. By comparing these smoothed averages, the indicator generates an oscillator that fluctuates around a zero line, revealing the current market momentum.
Traders can customize the indicator by adjusting the short and long periods, as well as selecting from various smoothing types like HMA, SMA, SMMA, EMA, WMA, and JMA. These parameters allow traders to fine-tune the indicator's sensitivity and responsiveness to market conditions.
Why it may be useful
This indicator provides traders with a dynamic tool to assess market sentiment and potential trend reversals by measuring buying and selling pressure. By analyzing the difference between short and long smoothed averages of the Accumulation/Distribution line, traders can gain insights into the underlying market dynamics that might not be immediately apparent from price action alone.
The oscillator's ability to clearly distinguish between bullish and bearish market conditions through its color-coded zero line crossovers makes it a valuable tool for traders seeking to make more informed trading decisions and identify potential entry and exit points.
When to explore it
The Chaikin-Bull-PW Indicator is most effective in markets with clear trending characteristics, where buying and selling pressures are distinct and measurable. It works particularly well when combined with other technical analysis tools to confirm signals and provide a more comprehensive market analysis.
Traders should consider using this indicator across different timeframes and asset classes, adjusting its parameters to match the specific characteristics of the instrument being traded. It is especially useful during periods of market volatility when understanding the underlying momentum can provide a significant trading advantage.
Keep exploring
What we’ve verified
Access, alerts and repainting behaviour have not been independently verified for this indicator. Check the creator’s current publication and settings.
General descriptions and classifications are recovered research. Verified details above identify the specific checks we have completed. Check the creator’s current publication for later changes.