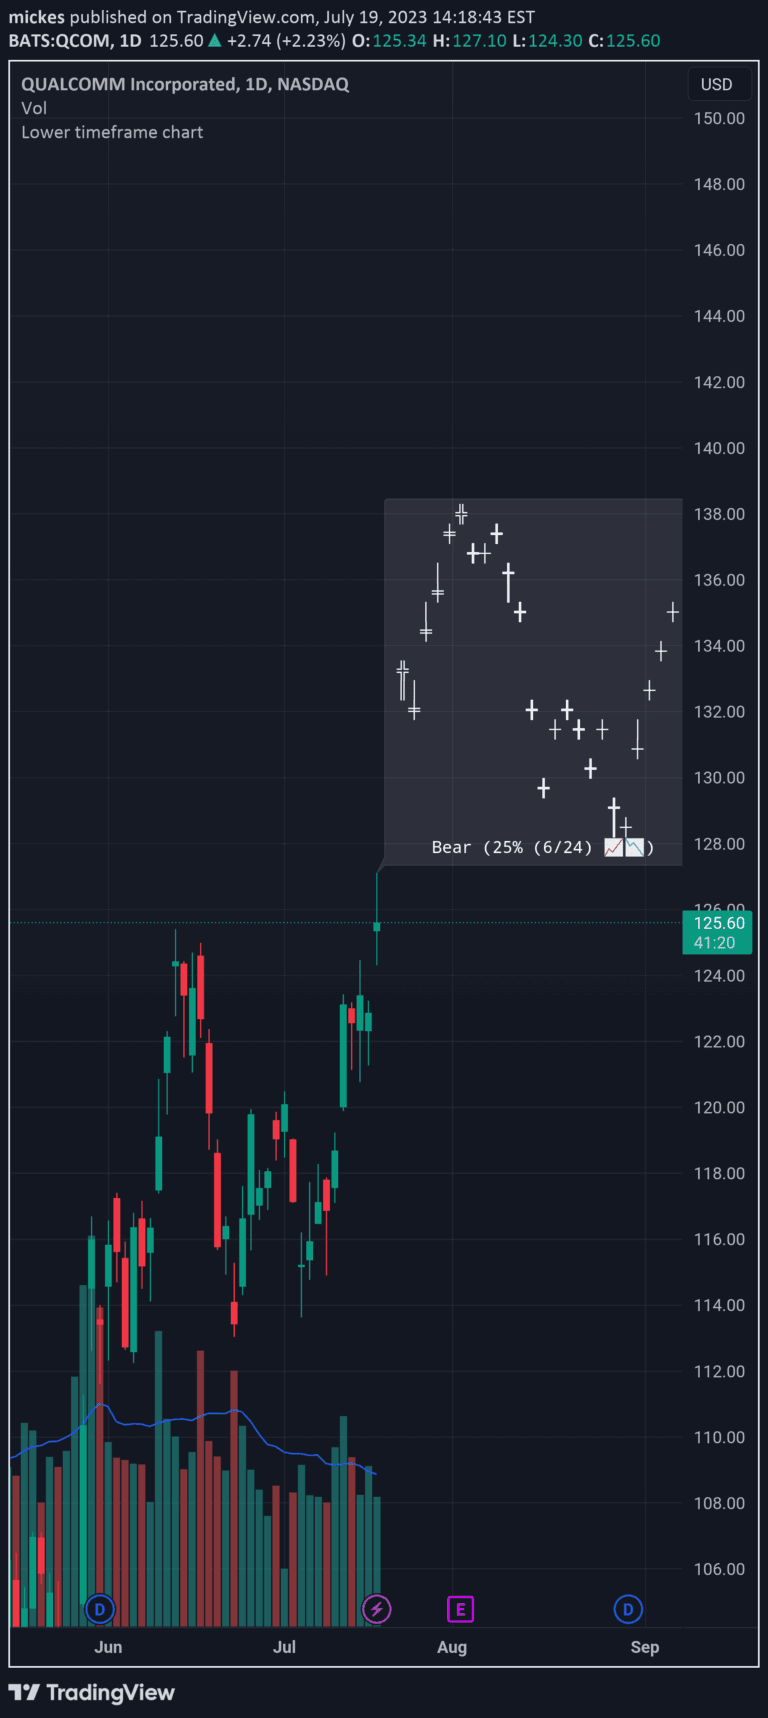
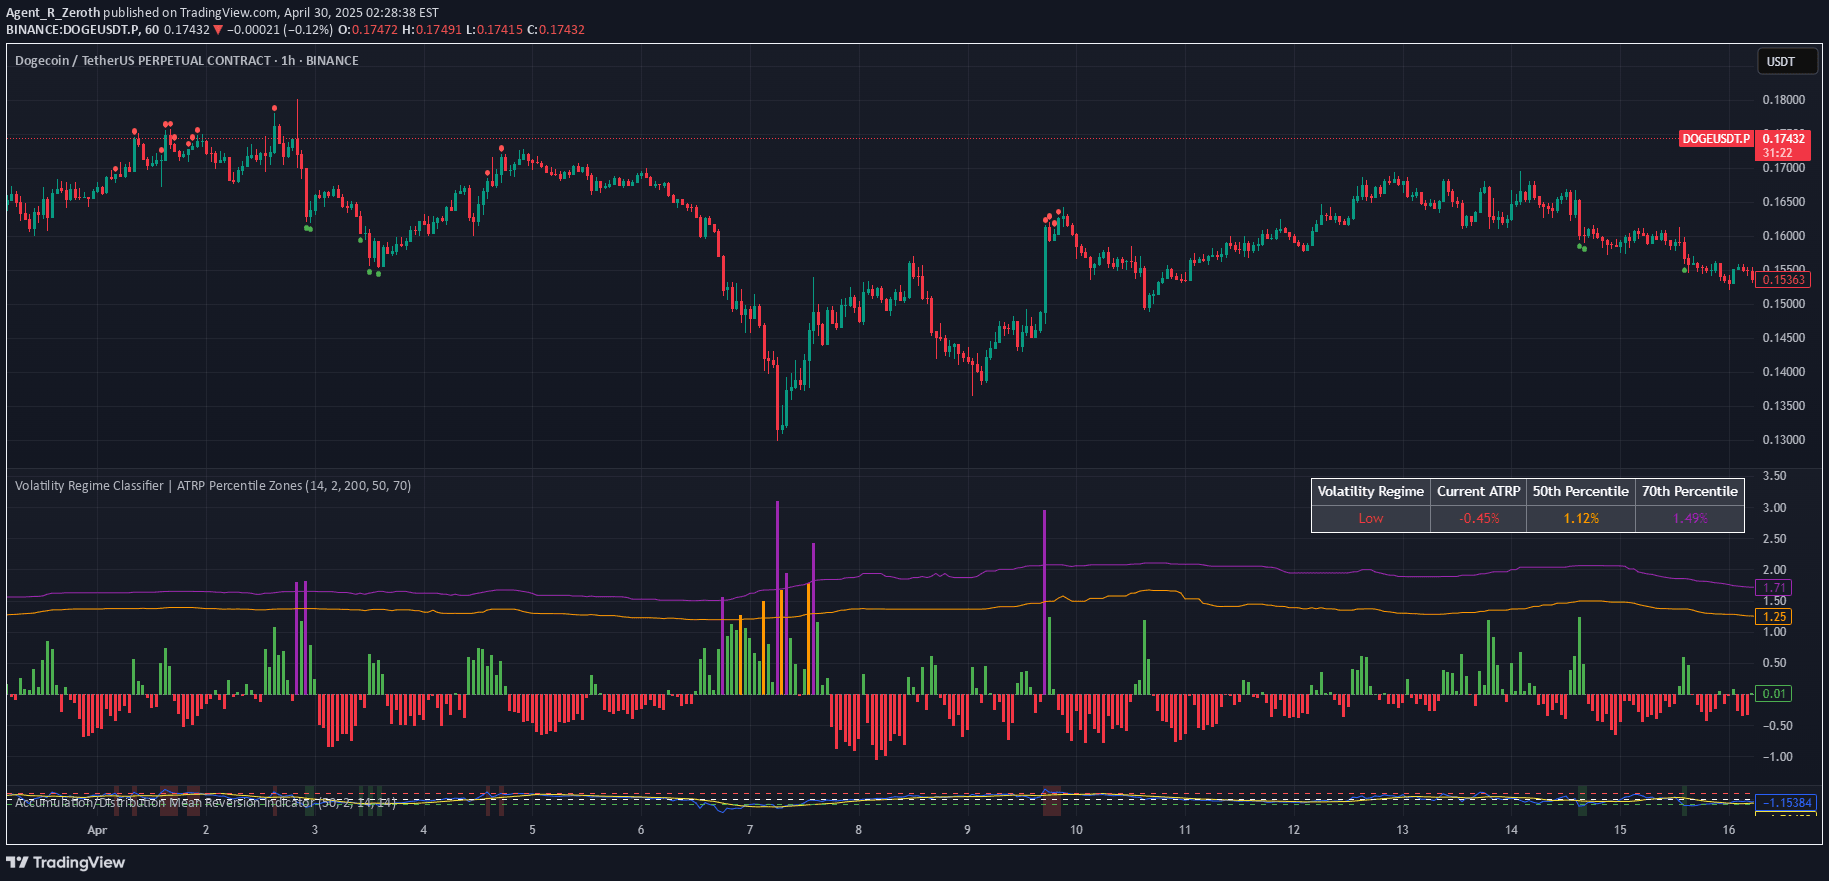
A chart measurement tool that helps traders quickly understand the current chart's price range and time frame, providing instant context for potential trading decisions.
Explore complementary indicator rolesHow it works
The indicator retrieves the time and bar index of the chart's beginning using the PineCoders VisibleChart library. It calculates and displays the X and Y distance of all elements currently visible on the chart, providing traders with precise measurements of price movement and time span.
By dynamically adapting to the current chart view, the tool automatically updates its measurements as traders zoom or change timeframes. This ensures traders always have an accurate representation of the chart's price range and temporal context without manually using measurement tools.
Why it may be useful
Traders often struggle to maintain perspective when analyzing charts, losing track of price volatility and time scale. This indicator solves that problem by providing instant, visual context about the current chart's price and time dimensions.
By offering a quick, adaptable measurement tool, traders can make more informed decisions about trade entry, exit, and overall market conditions. The indicator helps prevent misinterpretation of price movements by clearly showing the actual price range and time span being analyzed.
When to explore it
This tool is most effective for traders who frequently change chart views or work across multiple timeframes. It's particularly useful for day traders and scalpers who need quick, precise information about price movement and chart context.
Traders can benefit from this indicator when analyzing short-term price action, comparing different time periods, or quickly assessing the relevance of a particular chart view to their trading strategy. It's especially helpful when transitioning between different chart settings or timeframes.
Keep exploring
What we’ve verified
Access, alerts and repainting behaviour have not been independently verified for this indicator. Check the creator’s current publication and settings.
General descriptions and classifications are recovered research. Verified details above identify the specific checks we have completed. Check the creator’s current publication for later changes.