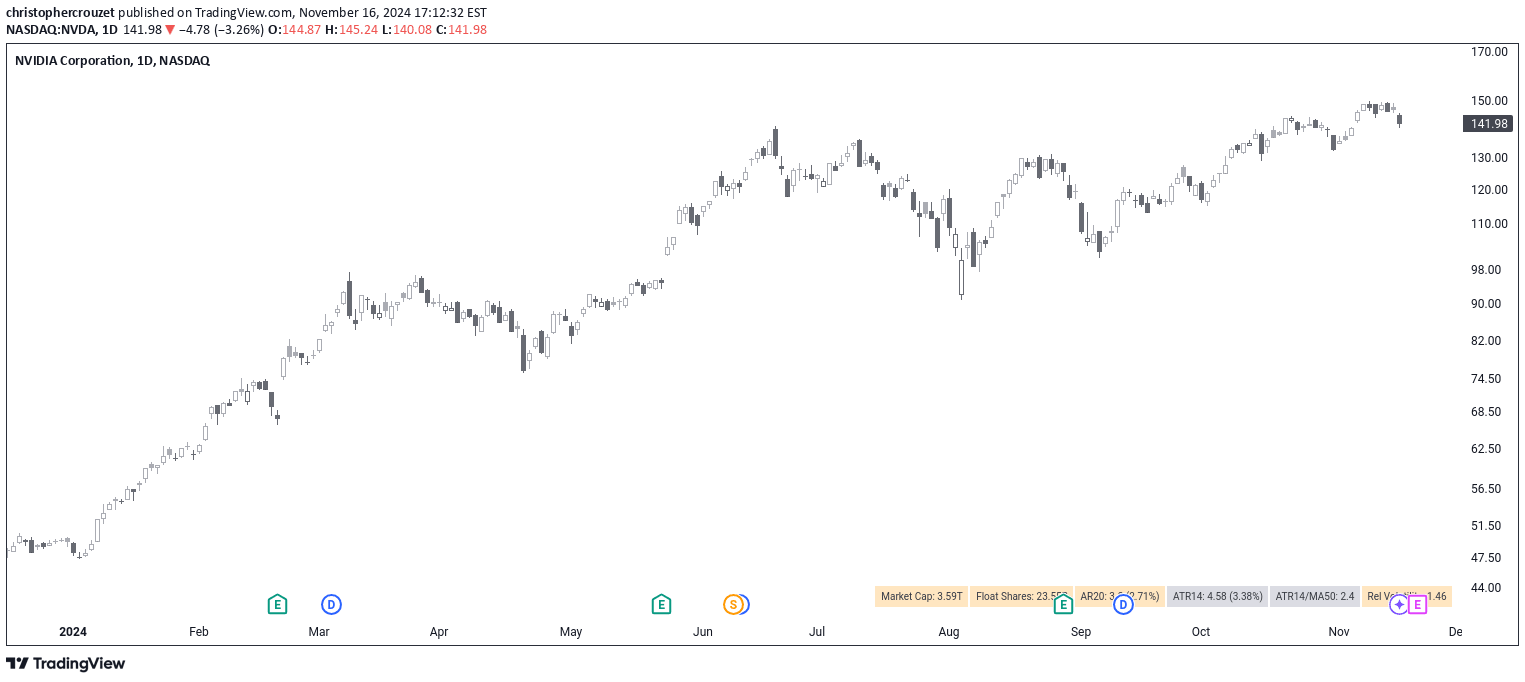
A comprehensive trading metric overview displaying key market characteristics like market cap, float shares, and range metrics to help traders assess stock potential and trading conditions.
Explore complementary indicator rolesHow it works
This signal aggregates multiple key market metrics into a single, easily digestible table format for quick trader analysis. It calculates and displays critical stock characteristics such as market capitalization, available trading shares, and various range measurements like Average True Range (ATR).
The signal provides multiple technical perspectives by showing how current price relates to moving averages, quantifying volatility through range measurements, and presenting relative volatility metrics. These calculations help traders understand the stock's current trading environment and potential movement characteristics.
Why it may be useful
Comprehensive market metrics help traders make more informed decisions by providing a holistic view of a stock's current trading landscape. These metrics offer insights into a stock's liquidity, trading potential, and inherent volatility, which are crucial for risk management and trade selection.
By presenting multiple technical perspectives simultaneously, traders can quickly assess a stock's characteristics without performing complex calculations manually. The signal's ability to highlight metrics crossing specific thresholds provides additional warning signals about potential trading conditions.
When to explore it
This signal is most effective when traders need a quick, comprehensive overview of a stock's current market conditions before entering a trade. It is particularly useful during market open, when making initial trade assessments, or when evaluating potential new trading opportunities.
Traders should utilize this signal across different timeframes, from scalping to swing trading, as it provides universal insights into a stock's technical characteristics. It is especially valuable when comparing multiple stocks or assessing a single stock's changing market dynamics throughout different trading sessions.
Keep exploring
What we’ve verified
Access, alerts and repainting behaviour have not been independently verified for this indicator. Check the creator’s current publication and settings.
General descriptions and classifications are recovered research. Verified details above identify the specific checks we have completed. Check the creator’s current publication for later changes.