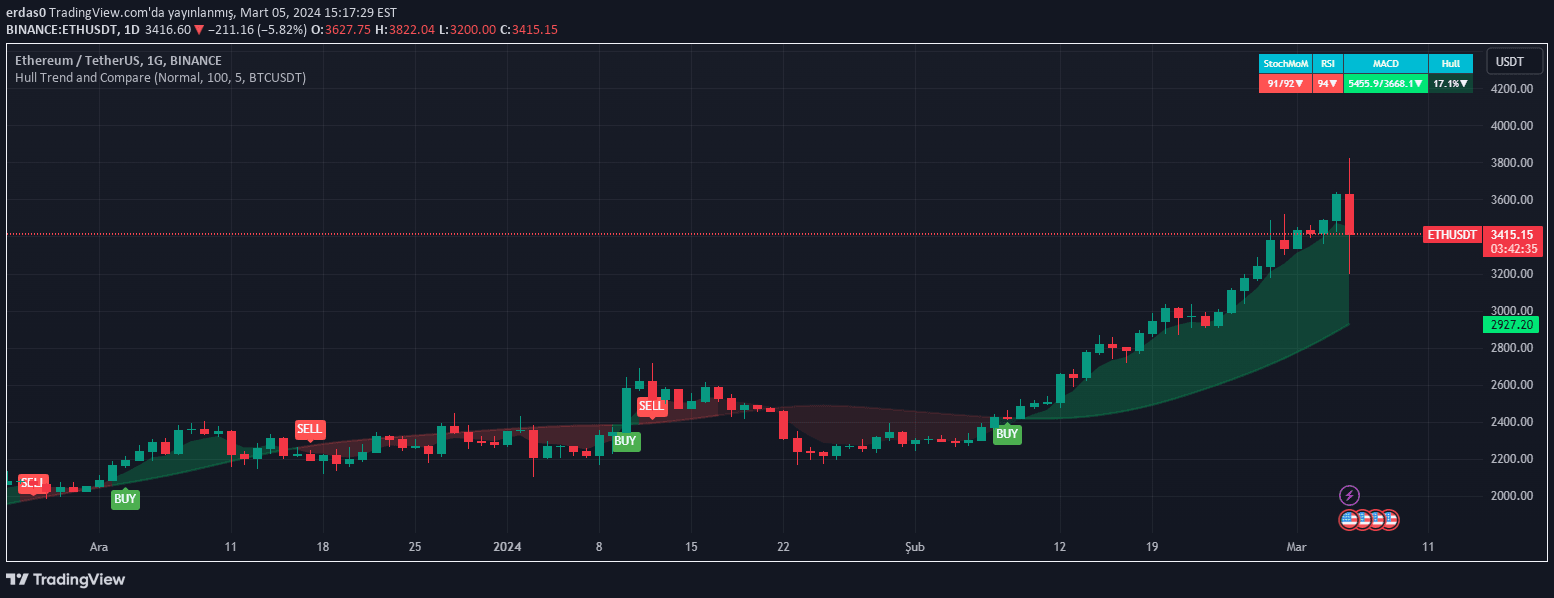
A comparative chart tool for analyzing two cryptocurrency tickers simultaneously, allowing direct performance visualization and relative strength assessment between trading pairs.
Explore complementary indicator rolesHow it works
The script compares two cryptocurrency tickers on a single chart, enabling traders to visualize their relative performance side by side. By default, it uses BTC and LTC, but can be customized to compare any trading pair, providing a dynamic visual representation of price movements and potential correlations.
The comparison is executed through overlaying both tickers' price charts, allowing for quick and intuitive assessment of their respective trends, volatility, and potential divergences. Traders can easily adjust the parameters to suit their specific analysis needs, making it a flexible tool for multi-asset performance evaluation.
Why it may be useful
Comparing multiple assets on a single chart provides traders with immediate insights into relative market performance and potential trading opportunities. This approach allows for quick identification of stronger and weaker assets, helping traders make more informed decisions about capital allocation and potential entry or exit points.
By visualizing the relationship between different cryptocurrencies, traders can better understand market dynamics, correlation patterns, and potential lead-lag relationships. This comparative analysis can reveal underlying market trends that might not be apparent when examining assets in isolation.
When to explore it
This comparative charting technique is most effective during periods of market volatility or when analyzing potential correlations between different cryptocurrency assets. Traders can utilize this tool during significant market events, when exploring potential diversification strategies, or when seeking to understand the relative strength of different trading pairs.
The script is particularly useful for traders looking to develop a more comprehensive view of market movements, compare performance across different time frames, and identify potential trading opportunities based on relative asset performance. It can be especially valuable during trending markets or when analyzing the impact of broader market conditions on specific cryptocurrency pairs.
Keep exploring
What we’ve verified
Access, alerts and repainting behaviour have not been independently verified for this indicator. Check the creator’s current publication and settings.
General descriptions and classifications are recovered research. Verified details above identify the specific checks we have completed. Check the creator’s current publication for later changes.