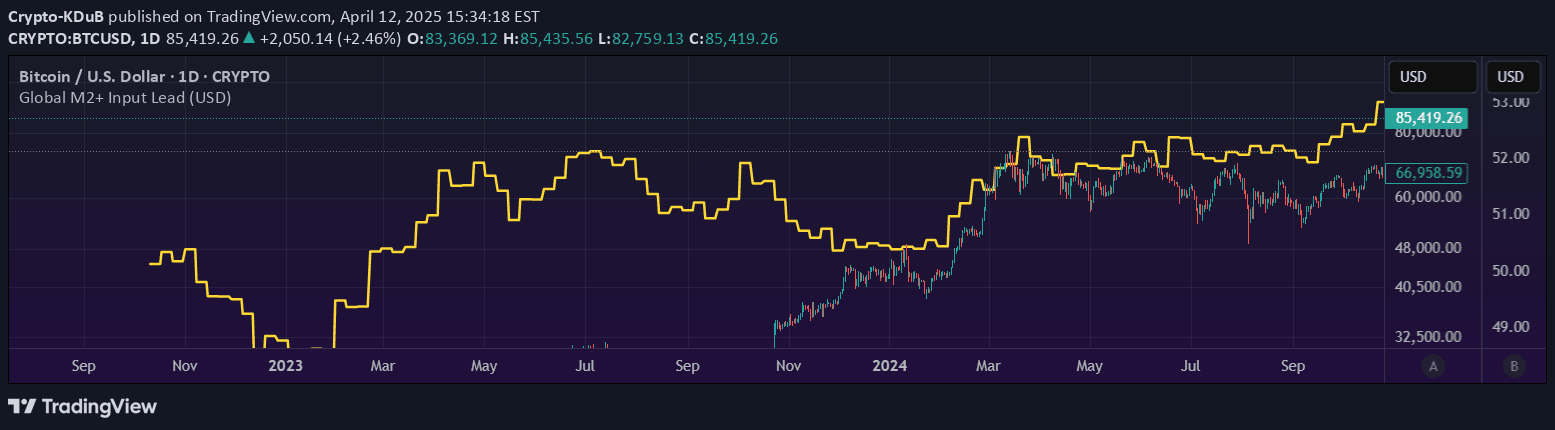
A TradingView tool that inverts and shifts China's 10-Year Government Bond Yield to help traders analyze leading or lagging relationships with other financial assets.
Explore complementary indicator rolesHow it works
The indicator takes the China 10-Year Government Bond Yield from TVC:CN10Y and inverts the value by multiplying it by -1, creating a visual representation that reverses the yield's movement. Users can specify a time lead or lag in months, which shifts the yield forward or backward based on the chart's timeframe, typically calculated as 20 bars per month on daily charts.
By inverting and shifting the yield, the tool enables traders to explore potential correlations and leading/lagging relationships with other financial instruments. The inverted yield is plotted as a blue line in a separate panel, accompanied by a zero line for reference, allowing for easier comparative analysis.
Why it may be useful
This indicator provides traders with a unique perspective on yield dynamics by inverting and time-shifting the data, which can reveal hidden relationships between different financial assets. It allows for a more nuanced understanding of how changes in government bond yields might precede or follow movements in other markets, such as the PBOC Balance Sheet or Bitcoin price.
By presenting the yield in an inverted format, traders can more easily identify potential leading indicators and understand complex market interconnections. The tool's flexibility in adjusting time leads and lags enables more sophisticated analysis of market relationships that might not be immediately apparent.
When to explore it
The China 10-Year Yield Inverted indicator is most effective for traders seeking to understand long-term macroeconomic trends and potential correlations between different financial instruments. It is particularly useful for swing traders and investors who are interested in analyzing broader economic relationships and potential leading indicators.
Traders should use this tool when examining potential connections between government bond yields and other financial assets, especially when looking for predictive relationships or seeking to understand broader economic trends. It is most valuable for those conducting in-depth market analysis and looking to gain insights beyond traditional price-based indicators.
Keep exploring
What we’ve verified
Access, alerts and repainting behaviour have not been independently verified for this indicator. Check the creator’s current publication and settings.
General descriptions and classifications are recovered research. Verified details above identify the specific checks we have completed. Check the creator’s current publication for later changes.