A quarter-based trading indicator that identifies significant price shifts by calculating percentage changes between quarterly closing prices and signaling movements exceeding 4%.
Explore complementary indicator rolesHow it works
The Quarter Shift Identifier tracks the closing price of each financial quarter, monitoring price transitions systematically. When a new quarter begins, the indicator calculates the percentage change from the previous quarter's closing price, establishing a comparative baseline for price movement.
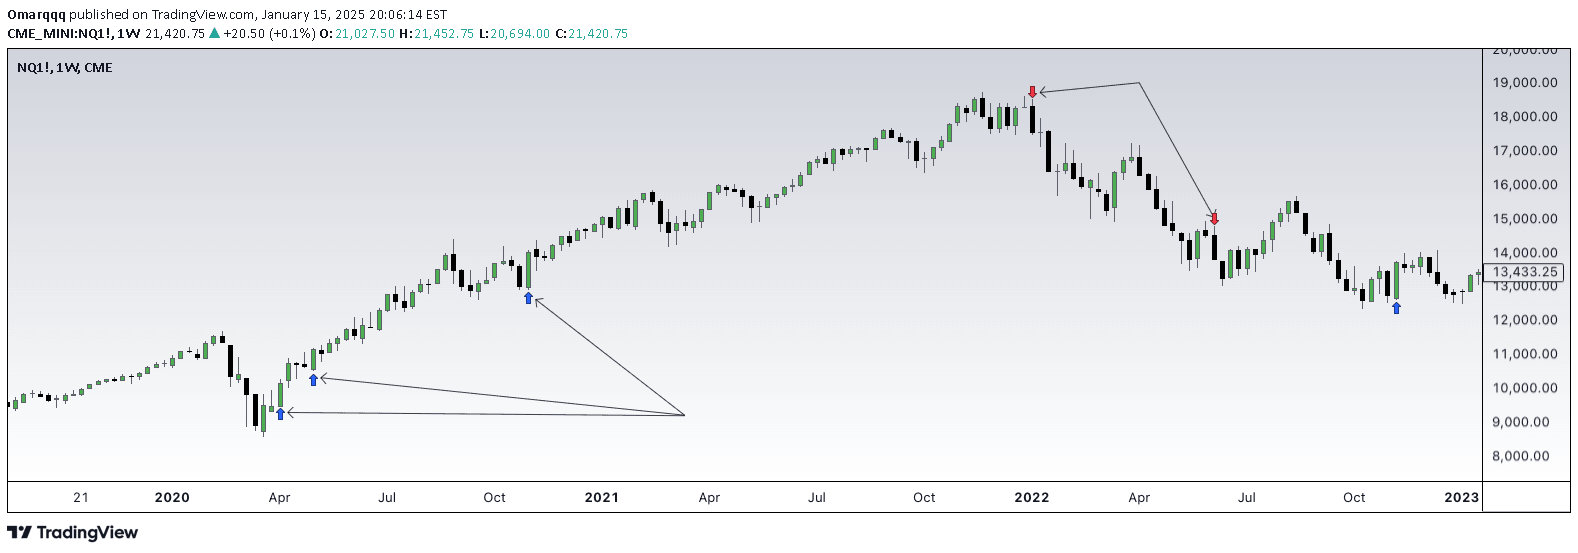
If the calculated percentage change exceeds the predefined 4% threshold, the indicator generates a visual signal on the chart. Blue up arrows represent bullish shifts, indicating potential upward price momentum, while red down arrows signify bearish shifts, suggesting potential downward price trends.
Why it may be useful
The Quarter Shift Identifier provides traders with a structured approach to understanding broader market movements across quarterly boundaries. By highlighting significant price transitions, the indicator helps traders recognize potential trend changes and seasonal market behaviors that might not be immediately apparent on shorter timeframes.
This tool offers a unique perspective on market dynamics, allowing traders to supplement their existing technical analysis strategies with quarter-based insights. Its ability to systematically track and signal meaningful price shifts can help traders make more informed decisions about market entry and exit points.
When to explore it
The Quarter Shift Identifier is most effective when applied to weekly and daily charts, where longer-term price trends and quarterly transitions can be more clearly observed. Traders seeking to understand broader market movements and potential seasonal patterns will find this indicator particularly useful for strategic planning.
It is especially valuable for swing traders and investors who are interested in capturing multi-day or multi-week price movements. By providing a macro view of price changes, the indicator can help traders identify potential trend reversals and significant market shifts that occur at quarterly intervals.
Keep exploring
What we’ve verified
Access, alerts and repainting behaviour have not been independently verified for this indicator. Check the creator’s current publication and settings.
General descriptions and classifications are recovered research. Verified details above identify the specific checks we have completed. Check the creator’s current publication for later changes.