
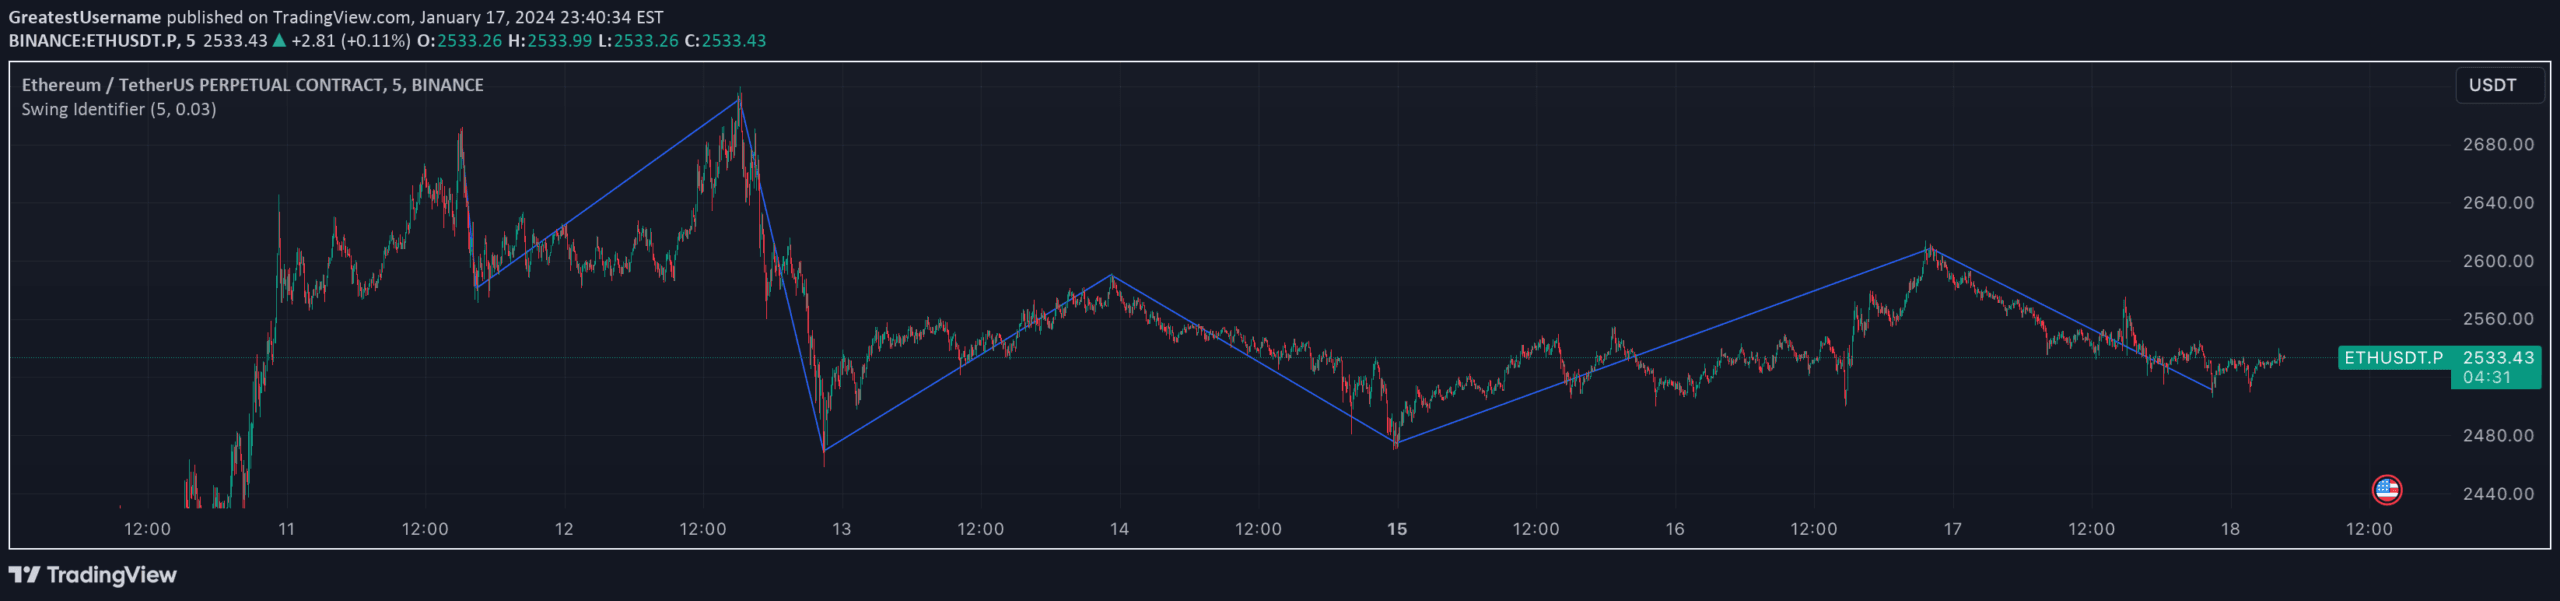
A custom Pine Script indicator that identifies and marks swing highs and lows on trading charts, helping traders visualize potential trend reversals and support/resistance zones.
Explore complementary indicator rolesHow it works
The Swing Identifier uses pivot point analysis to detect significant price swings by examining a specified number of bars to the left and right of the current bar. It employs ta.pivothigh and ta.pivotlow functions to identify potential swing highs and lows, allowing traders to customize the sensitivity through range and strength inputs.
The script implements a toggle mechanism to sequentially identify highs and lows, ensuring a logical progression of swing points. When a new swing is detected that meets the percentage change criteria, the indicator draws lines connecting previous and current swing points, dynamically updating the visual representation of market movement.
Why it may be useful
By providing a visual representation of market swings, this indicator helps traders understand underlying price dynamics and potential trend shifts more intuitively. It transforms abstract price movements into clear, actionable visual information that can enhance decision-making and market analysis.
The customizable nature of the Swing Identifier allows traders to adapt the tool to different market conditions, trading styles, and asset characteristics. This flexibility makes it a versatile tool for identifying support and resistance levels, potential trend reversals, and key price action points across various financial instruments.
When to explore it
The Swing Identifier is most effective in markets with clear trending characteristics, where price movements exhibit identifiable swing patterns. It works best on timeframes that allow sufficient bar range for meaningful swing detection, such as daily, 4-hour, and hourly charts where price fluctuations are more pronounced.
Traders should utilize this indicator when seeking to understand market structure, identify potential entry and exit points, and gain insights into trend strength and potential reversals. It is particularly useful for technical analysts who rely on visual cues and systematic approaches to market analysis.
Keep exploring
What we’ve verified
Access, alerts and repainting behaviour have not been independently verified for this indicator. Check the creator’s current publication and settings.
General descriptions and classifications are recovered research. Verified details above identify the specific checks we have completed. Check the creator’s current publication for later changes.


