A trading indicator that plots zones representing market conditions, helping traders identify chop days, bullish trend days, and bearish trend days through price action probability analysis.
Explore complementary indicator rolesHow it works
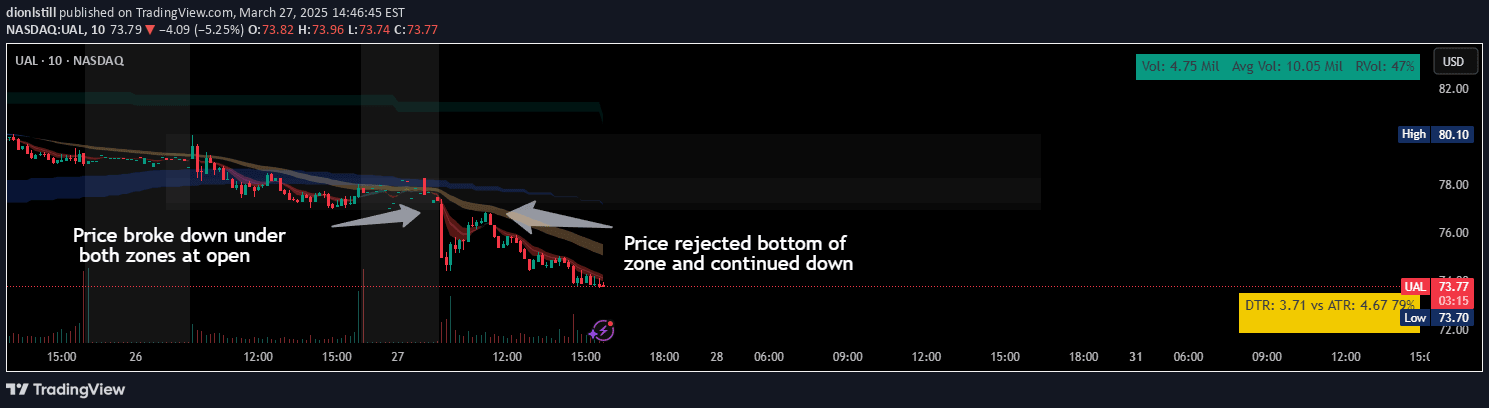
The indicator creates two shaded zones based on price levels: one between the Previous Market High (PMH) and Previous Market Low (PML), and another between the Previous Day High (PDH) and Previous Day Low (PDL).
By analyzing the shaded areas' intensity, traders can determine the likelihood of choppy or trending market conditions. More intensely shaded zones indicate higher probability of choppy price action, while less shaded or unshaded areas suggest higher probability of a trending market
Why it may be useful
This indicator provides traders with a visual tool to quickly assess market conditions and potential price behavior. By identifying whether the market is likely to be choppy or trending, traders can adapt their strategies accordingly.
Understanding the probability of price action helps in making more informed trading decisions, managing risk, and selecting appropriate entry and exit points based on the expected market dynamics
When to explore it
The indicator works best during intraday trading, particularly for day traders seeking to understand market conditions quickly. It is most effective in liquid markets with clear price action, such as major stock indices, popular stocks, and forex pairs. Traders should use this indicator in conjunction with other technical analysis tools to confirm signals and reduce false positives
Keep exploring
What we’ve verified
Access, alerts and repainting behaviour have not been independently verified for this indicator. Check the creator’s current publication and settings.
General descriptions and classifications are recovered research. Verified details above identify the specific checks we have completed. Check the creator’s current publication for later changes.