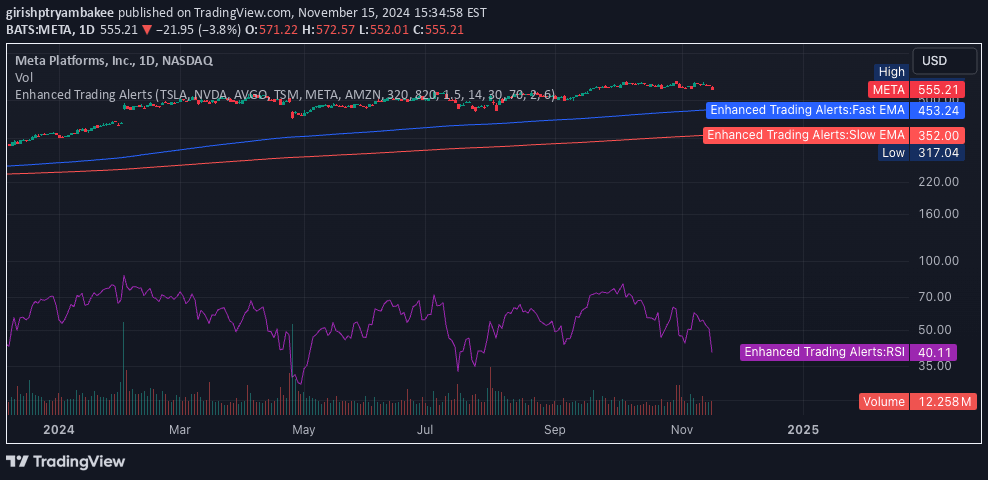
A lightweight trading signal that generates alerts when the current candle closes above the previous candle's high or below its low, providing simple trend direction insights across multiple timeframes.
Explore complementary indicator rolesHow it works
The signal operates by comparing the current candle's closing price with the high and low of the previous candle, creating a straightforward trend identification mechanism. When the current candle closes above the previous candle's high, it suggests a potential bullish momentum shift, indicating buyers are gaining strength and pushing prices higher.
Conversely, when the current candle closes below the previous candle's low, it signals a potential bearish momentum change, suggesting sellers are taking control and driving prices downward. This method provides traders with a simple yet effective way to detect immediate trend reversals or continuations across different timeframes.
Why it may be useful
This signal is crucial for traders seeking a quick, uncomplicated method to identify potential trend changes without relying on complex technical indicators. By focusing on raw price action and immediate candle relationships, traders can make rapid decisions based on clear, observable market movements.
The signal's simplicity allows traders to quickly assess market sentiment and potential directional shifts, which is particularly valuable in fast-moving markets where split-second decisions can make significant differences. Its versatility across multiple timeframes makes it a flexible tool for various trading styles and market conditions.
When to explore it
The signal works best in markets with clear, directional price movements and during periods of moderate to high volatility where distinct candle patterns emerge. It is particularly effective for traders who prefer simple, price action-based strategies and want to quickly identify potential trend changes without complex analysis.
Traders should be most attentive to this signal during key market sessions, such as market opens, economic news releases, or periods of significant market activity. While powerful, it should not be used in isolation and is most effective when combined with other technical analysis tools and risk management strategies.
Keep exploring
What we’ve verified
Access, alerts and repainting behaviour have not been independently verified for this indicator. Check the creator’s current publication and settings.
General descriptions and classifications are recovered research. Verified details above identify the specific checks we have completed. Check the creator’s current publication for later changes.