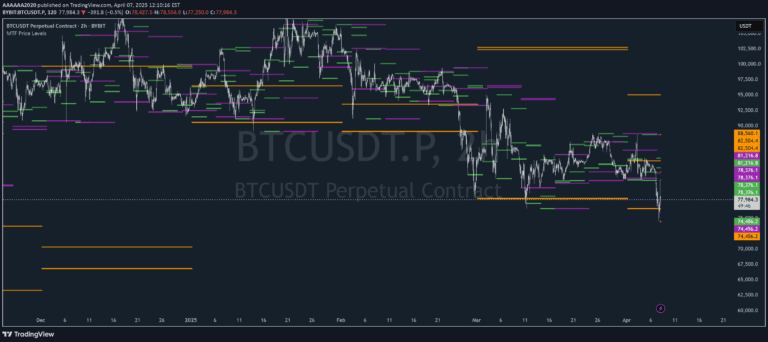
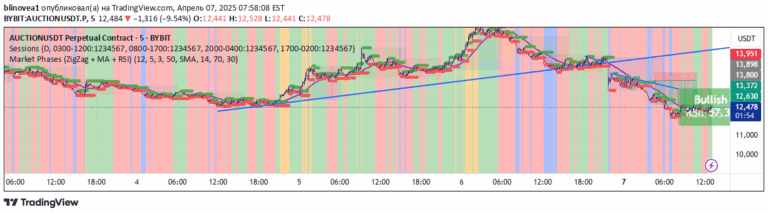
A sophisticated trading indicator that combines Tribonacci, Tetranacci, and Lucas mathematical sequences to identify dynamic support and resistance levels across multiple financial markets.
Explore complementary indicator rolesHow it works
The Combined Sequences Indicator calculates multiple mathematical sequence levels based on selected price sources and timeframes. It generates Tribonacci, Tetranacci, and Lucas levels that are plotted directly on the trading chart, providing visual reference points for potential support and resistance zones.
Traders can customize the indicator by selecting the number of levels, choosing specific sequences, and adjusting line styles and extensions. The tool allows flexible configuration, enabling users to focus on the most relevant mathematical sequence levels for their specific trading strategy and market analysis.
Why it may be useful
Mathematical sequence-based indicators offer traders a unique perspective on market dynamics by revealing hidden structural patterns in price movement. These advanced levels provide insights beyond traditional technical analysis tools, helping traders identify potential turning points and entry/exit opportunities with greater precision.
By integrating multiple sequence types, the indicator enhances market analysis capabilities, offering a more comprehensive view of potential support and resistance zones. Traders can leverage these advanced mathematical levels to make more informed trading decisions and develop more sophisticated trading strategies.
When to explore it
The Combined Sequences Indicator is most effective in markets with clear trending or ranging behavior, where mathematical sequence levels can provide meaningful insights into potential price reversals and continuation patterns. It works exceptionally well across different financial instruments, including stocks, forex, cryptocurrencies, and commodities.
Traders should use this indicator in conjunction with other technical analysis tools to confirm signals and validate potential trade setups. It is particularly useful for identifying dynamic support and resistance levels, helping traders make more precise entry, exit, and stop-loss decisions across various timeframes.
Keep exploring
What we’ve verified
Access, alerts and repainting behaviour have not been independently verified for this indicator. Check the creator’s current publication and settings.
General descriptions and classifications are recovered research. Verified details above identify the specific checks we have completed. Check the creator’s current publication for later changes.