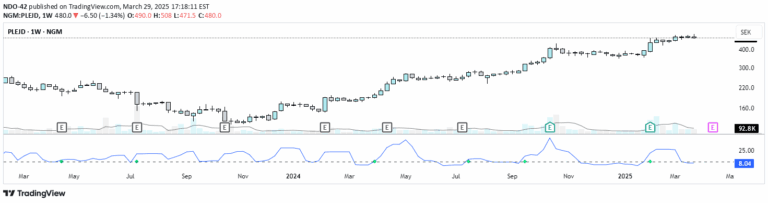
A precision trading indicator that identifies price compression patterns in trending markets, combining multiple tight range formations with trend and proximity filters for high-probability trading setups.
Explore complementary indicator rolesHow it works
The indicator operates by detecting specific price compression patterns like NR4, NR7, 2-Bar NR, 3-Bar NR, and Inside Day formations across market price action. It systematically scans for periods of reduced volatility where price ranges tighten, signaling potential future explosive movements.
These compression patterns are then filtered through a strict trend confirmation mechanism using an EMA stack, ensuring signals only trigger when the 10 EMA is above the 20 EMA and 50 EMA, with price positioned above the 20 EMA. An additional proximity filter ensures the price is within one Average True Range (ATR) of key moving averages, adding another layer of precision to the signal generation process.
Why it may be useful
This indicator provides traders with a sophisticated, context-aware approach to identifying high-probability trading opportunities by combining multiple technical analysis techniques. It moves beyond simple pattern recognition by integrating trend strength, volatility compression, and precise entry conditions, which dramatically improves the quality of potential trade setups.
By focusing on trend-following strategies with disciplined entry criteria, the indicator helps traders avoid random, low-probability trades and instead concentrate on moments where market conditions suggest a higher likelihood of significant price movement. This approach aligns with professional trading methodologies that prioritize patience, context, and statistical edge.
When to explore it
The indicator is most effective in markets exhibiting clear, established uptrends with periods of consolidation, making it ideal for swing trading and day trading strategies. It works best on daily charts where price has demonstrated a consistent directional bias and shows signs of temporary volatility contraction.
Traders should apply this signal when seeking high-quality entry points during trending market conditions, particularly when price is pulling back to key moving averages or showing signs of coiling before a potential breakout. It is especially powerful when used in conjunction with additional confirmatory indicators like VWAP or MACD to further validate the potential trade opportunity.
Keep exploring
What we’ve verified
Access, alerts and repainting behaviour have not been independently verified for this indicator. Check the creator’s current publication and settings.
General descriptions and classifications are recovered research. Verified details above identify the specific checks we have completed. Check the creator’s current publication for later changes.