
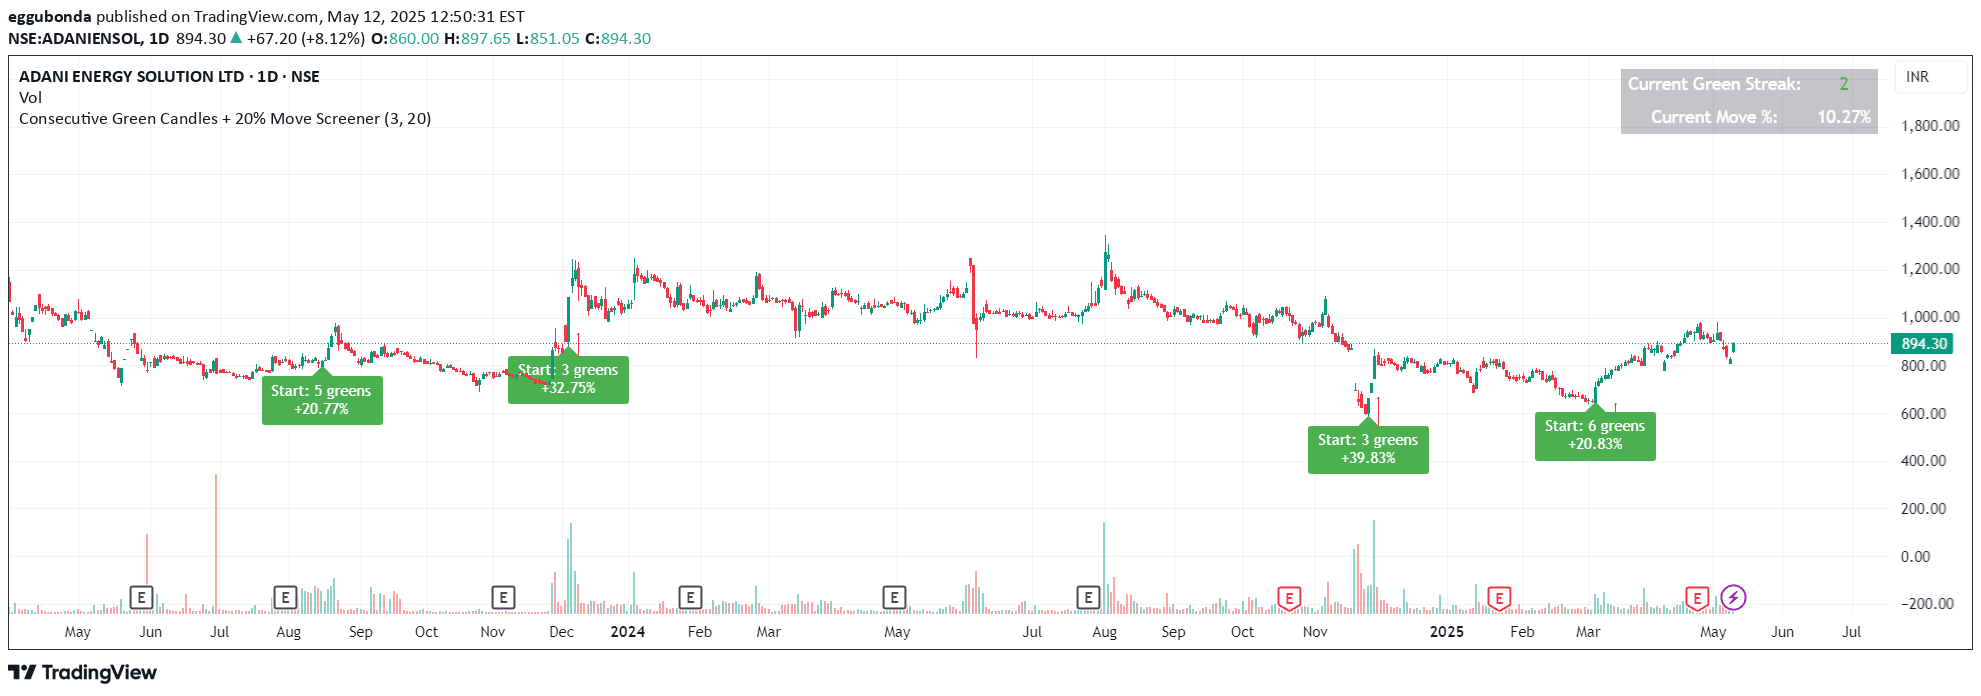
A momentum tracking indicator that identifies bullish streaks by monitoring consecutive green candles and calculating cumulative price increases over a specified threshold.
Explore complementary indicator rolesHow it works
The Consecutive Green Candles Momentum Tracker operates by scanning price action and identifying sequences of consecutive bullish candles that collectively move a stock's price beyond a predetermined percentage threshold. It meticulously tracks each green candle's contribution to the overall price movement, marking the beginning of a momentum streak with a green label.
When the price momentum begins to reverse or fails to meet the specified criteria, the indicator places a red arrow to signal the potential end of the bullish trend. Traders can customize the minimum number of candles and percentage threshold to align with their specific trading strategy and risk tolerance.
Why it may be useful
This momentum indicator provides traders with a powerful tool to quickly identify and visualize sustained bullish price movements across different financial instruments. By highlighting extended periods of consistent buying pressure, it helps traders recognize potentially strong trend continuation scenarios and assess the underlying market sentiment.
The ability to track and quantify momentum streaks enables traders to make more informed decisions about entry and exit points. It offers a systematic approach to identifying stocks experiencing significant directional movement, reducing emotional decision-making and providing a structured method for screening potential trading opportunities.
When to explore it
The Consecutive Green Candles Momentum Tracker is most effective in trending markets with clear directional movements, particularly during strong bullish cycles. It works best when applied to liquid stocks or instruments with consistent trading volumes that can sustain meaningful price momentum.
Traders should consider using this indicator during periods of market stability and when sector-specific trends are evident. It is particularly useful for identifying potential breakout stocks, screening for momentum-driven trading opportunities, and understanding the recent strength of price movements across different timeframes.
Keep exploring
What we’ve verified
Access, alerts and repainting behaviour have not been independently verified for this indicator. Check the creator’s current publication and settings.
General descriptions and classifications are recovered research. Verified details above identify the specific checks we have completed. Check the creator’s current publication for later changes.


