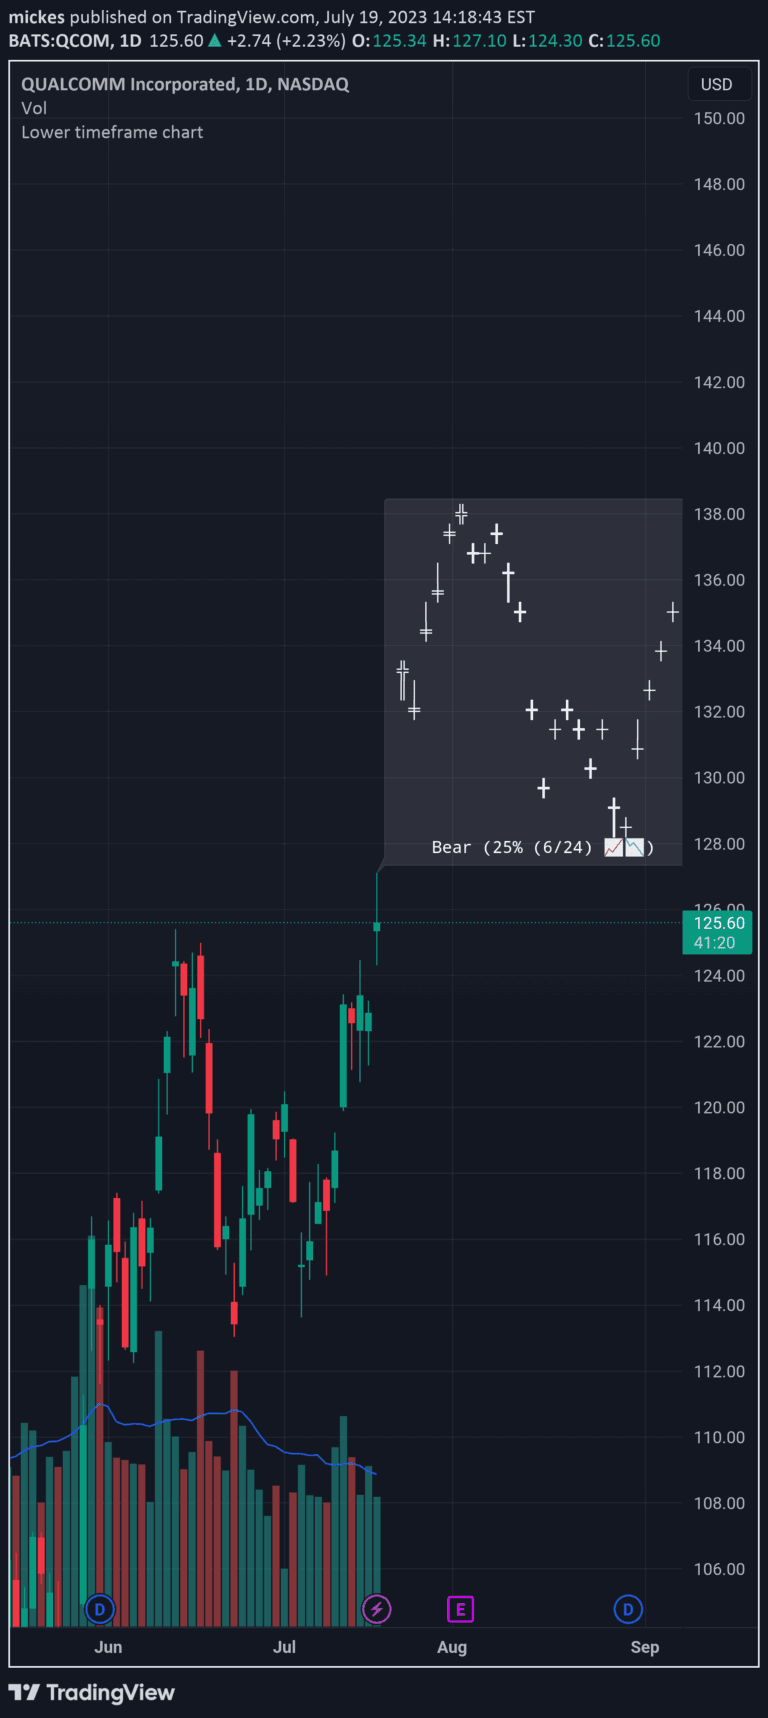
A technical indicator that generates buy and sell signals based on consecutive higher or lower closing prices, allowing traders to customize their entry and exit strategies.
Explore complementary indicator rolesHow it works
The Consecutive Higher/Lower Closings indicator operates by tracking the closing prices of successive price periods. Traders can set parameters defining the number of consecutive higher or lower closes required to trigger a signal. When the specified number of consecutive higher closes is achieved, a buy signal is generated, indicating potential bullish momentum.
Conversely, when the specified number of consecutive lower closes is met, a sell signal is triggered, suggesting potential bearish momentum. The indicator visually displays these signals as colored triangles on the chart, making it easy for traders to identify potential entry and exit points based on their predefined criteria.
Why it may be useful
The Consecutive Higher/Lower Closings indicator provides traders with a systematic approach to identifying potential trend changes and momentum shifts. By offering customizable parameters, it allows traders to adapt the signal generation to their specific trading style and risk tolerance. This flexibility enables more precise timing of trade entries and exits compared to traditional trend-following methods.
Moreover, the indicator helps traders objectify their decision-making process by providing clear, rules-based signals. It removes emotional bias from trading and offers a structured method to recognize emerging market trends, making it a valuable tool for both novice and experienced traders seeking to improve their market analysis and timing.
When to explore it
The Consecutive Higher/Lower Closings indicator is most effective when used with stocks or assets that demonstrate smooth, trending price action. It works particularly well on weekly and daily timeframes, where short-term market noise is reduced. Traders should apply this indicator in markets with clear directional movements, such as during strong bull or bear trends.
The signal is especially useful in markets with consistent momentum and low volatility. Traders should combine this indicator with other technical analysis tools like support and resistance levels, moving averages, or volume indicators to confirm signals and reduce false positives. It is recommended to backtest and optimize the consecutive period parameters for each specific trading instrument.
Keep exploring
What we’ve verified
Access, alerts and repainting behaviour have not been independently verified for this indicator. Check the creator’s current publication and settings.
General descriptions and classifications are recovered research. Verified details above identify the specific checks we have completed. Check the creator’s current publication for later changes.