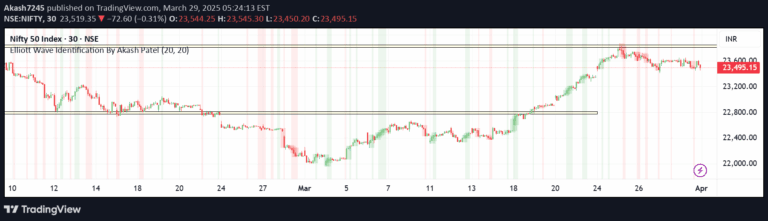
The Crab pattern is a harmonic trading pattern that identifies potential price reversals using Fibonacci ratios, helping traders predict trend changes in both bullish and bearish market conditions.
Explore complementary indicator rolesHow it works
The Crab pattern is a technical analysis tool that uses precise Fibonacci ratios to identify potential price reversal points on a chart. Traders analyze the pattern's structure by connecting specific price points that form a distinctive M (bullish) or W (bearish) shape, which helps predict potential trend changes.
By measuring the relationships between different price waves using specific Fibonacci percentages, traders can determine key entry and exit points. The pattern consists of several price waves that must adhere to strict geometric and mathematical relationships, allowing for precise identification of potential trend reversals in various financial markets.
Why it may be useful
The Crab pattern provides traders with a systematic approach to identifying potential market turning points by using mathematical relationships rather than subjective interpretations. It offers a structured method for analyzing price movements, which can help traders make more informed decisions about potential trend reversals and market entry or exit points.
By integrating Fibonacci ratios into pattern recognition, traders can develop a more disciplined and analytical approach to market analysis. The pattern helps reduce emotional trading by providing clear, quantifiable criteria for identifying potential trade opportunities, thereby enhancing a trader's ability to make strategic and objective trading decisions.
When to explore it
The Crab pattern is most effective in markets with clear trending characteristics, where price movements show distinct wave-like patterns and identifiable corrections. Traders should look for this pattern in timeframes that allow sufficient price movement to form the complete harmonic structure, such as daily or weekly charts.
The pattern works best when combined with other technical indicators and fundamental analysis to confirm potential trend reversals. Traders should pay special attention to the pattern's formation during periods of market consolidation or when price approaches key support and resistance levels, as these conditions often provide the most reliable signals for potential trend changes.
Keep exploring
What we’ve verified
Access, alerts and repainting behaviour have not been independently verified for this indicator. Check the creator’s current publication and settings.
General descriptions and classifications are recovered research. Verified details above identify the specific checks we have completed. Check the creator’s current publication for later changes.