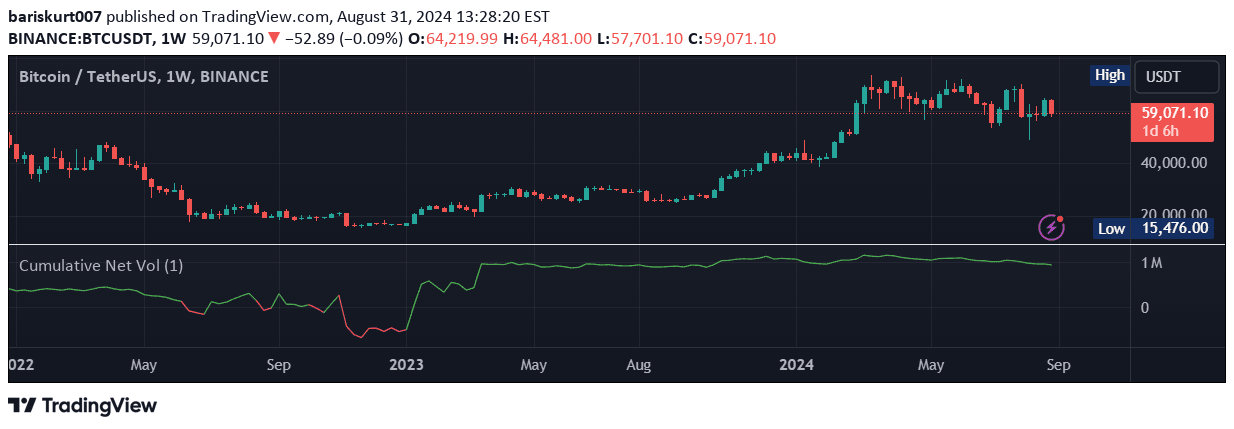
A cumulative net volume indicator that tracks buying and selling pressure across different timeframes, helping traders understand market dynamics through color-coded volume analysis.
Explore complementary indicator rolesHow it works
The cumulative net volume signal calculates the difference between buying and selling volume, creating a running total that reflects aggregate trading pressure. By subtracting selling volume from buying volume, the indicator generates a cumulative line that shows the net flow of trading activity over time.
Traders can customize the timeframe for analysis, allowing flexibility in examining volume dynamics across different market periods. The color-coded visualization provides an intuitive representation, with green indicating net buying pressure and red signaling net selling dominance, making it easier to interpret market sentiment and potential trend shifts.
Why it may be useful
Understanding volume dynamics is crucial for making informed trading decisions, as it provides insights into the strength and potential sustainability of price movements. This indicator helps traders gauge market sentiment by revealing whether buying or selling pressure is dominant, which can be a leading indicator of potential trend reversals or continuations.
By tracking cumulative net volume, traders can identify accumulation and distribution phases, gaining a deeper understanding of market psychology. The tool's versatility across different asset classes, including cryptocurrencies, stocks, and forex, makes it a valuable resource for traders seeking to enhance their market analysis and decision-making process.
When to explore it
The cumulative net volume indicator is most effective during periods of significant market activity or potential trend transitions. Traders can utilize this tool when looking to confirm trend strength, identify potential reversals, or assess the underlying momentum of price movements.
It is particularly useful during volatile market conditions, major news events, or when analyzing assets with complex trading dynamics. By providing a comprehensive view of buying and selling pressure, this indicator can help traders make more strategic entry and exit decisions across various timeframes and market scenarios.
Keep exploring
What we’ve verified
Access, alerts and repainting behaviour have not been independently verified for this indicator. Check the creator’s current publication and settings.
General descriptions and classifications are recovered research. Verified details above identify the specific checks we have completed. Check the creator’s current publication for later changes.