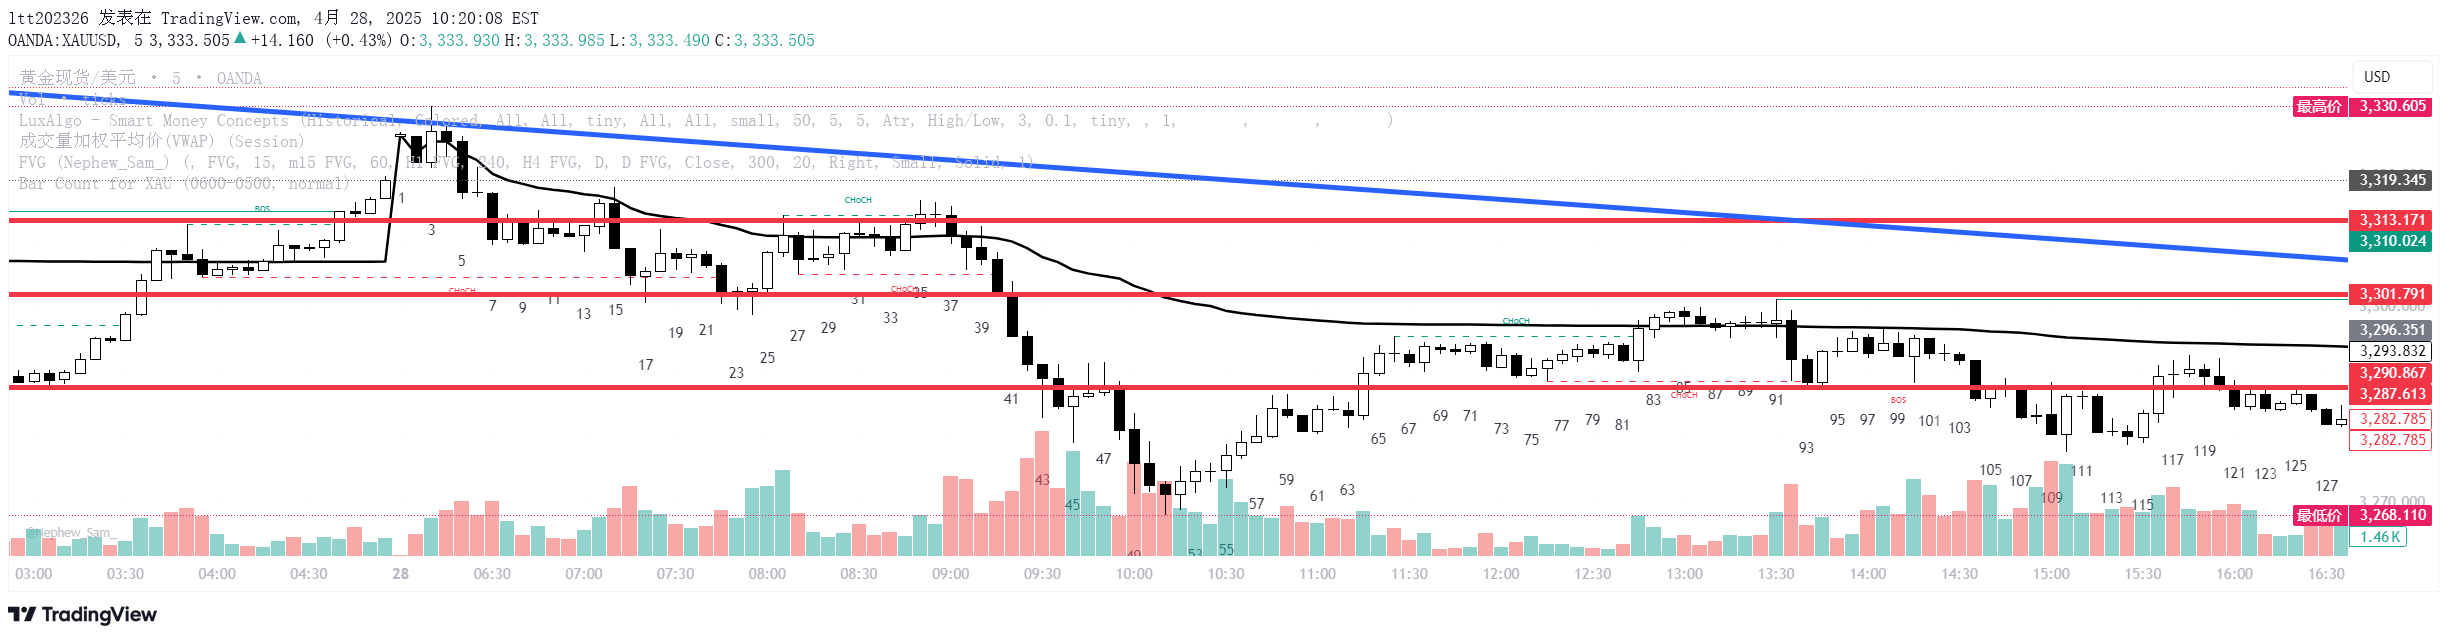
A trading signal that tracks the number of bars printed from a selected start date and time, providing traders with a simple count of price movements.
Explore complementary indicator rolesHow it works
The bar count signal begins tracking from a user-specified date and time, systematically counting each subsequent price bar that appears on the chart. It provides a straightforward numerical representation of market movement, incrementing with each new bar printed after the initial start point.
Traders can customize the starting point to align with specific market events, trading sessions, or strategic entry points. The signal offers a simple yet effective way to measure market activity, helping traders understand the progression of price action over a defined period.
Why it may be useful
Bar count signals offer traders a clear, objective method of tracking market movement and duration. They provide a simple numeric representation of market activity, helping traders understand the pace and consistency of price action during specific timeframes.
By offering an easy-to-interpret metric, these signals can help traders assess market momentum, identify periods of increased or decreased activity, and make more informed decisions about market conditions and potential trading opportunities.
When to explore it
Bar count signals are most effective during active trading sessions with consistent price movement. They work well for traders who want to track market activity across different timeframes, from short-term scalping to day trading scenarios.
These signals are particularly useful when monitoring specific market events, comparing market activity across different periods, or establishing a systematic approach to tracking price progression. Traders can leverage bar count signals to gain insights into market rhythm and potential trading opportunities.
Keep exploring
What we’ve verified
Access, alerts and repainting behaviour have not been independently verified for this indicator. Check the creator’s current publication and settings.
General descriptions and classifications are recovered research. Verified details above identify the specific checks we have completed. Check the creator’s current publication for later changes.