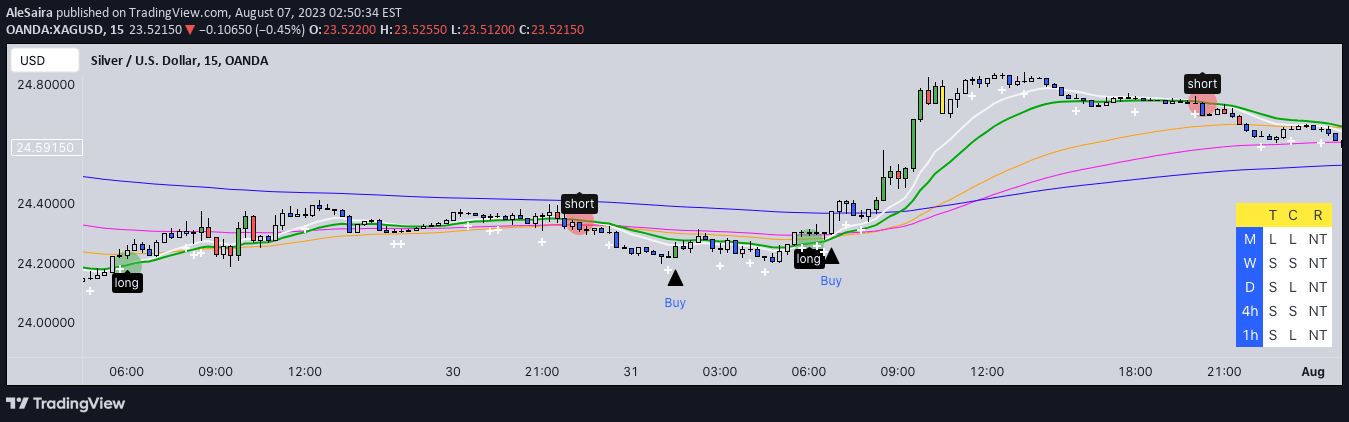
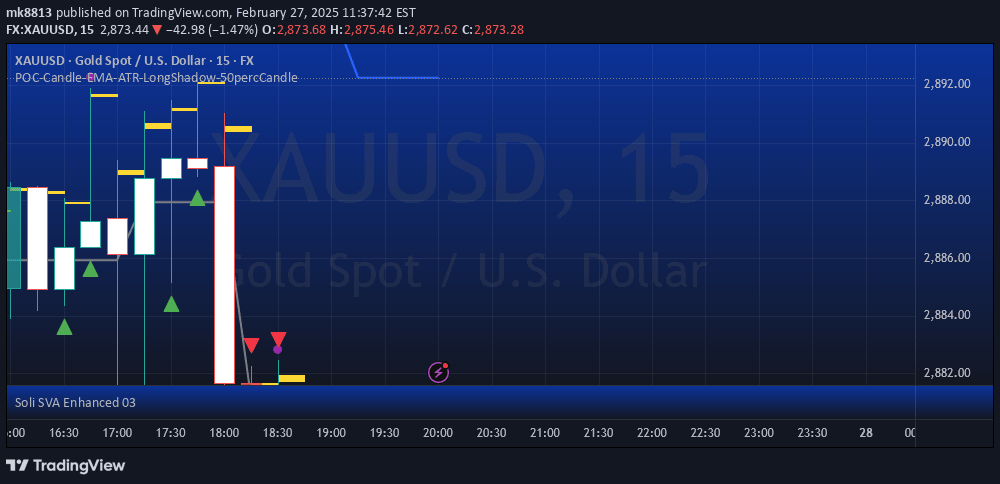
An EMA indicator that allows plotting previous period's Exponential Moving Average values on current candles, helping traders visualize historical moving average trends.
Explore complementary indicator rolesHow it works
This EMA plotting method allows traders to visualize historical moving average values directly on current price candles. By selecting an EMA value from X days ago, the indicator overlays that specific historical exponential moving average onto the current candle's chart, creating a dynamic representation of past trend movements.
The mechanism works by retrieving the previously calculated EMA value and projecting it onto the current candle's price space. This approach enables traders to compare current price action with historical moving average trends, providing a unique perspective on potential trend continuations or reversals.
Why it may be useful
This EMA plotting technique offers traders a sophisticated way to understand historical trend dynamics and potential future price movements. By visualizing past moving average values directly on current candles, traders gain insights into how trends have evolved and potentially predict future price behavior.
The indicator helps traders identify potential trend continuations, reversals, and underlying market momentum. It provides a nuanced view of price action by showing how previous exponential moving averages relate to current market conditions, enhancing technical analysis strategies.
When to explore it
This EMA plotting method is most effective in markets with clear trending characteristics, such as forex, stocks, and cryptocurrency markets. Traders can utilize this indicator during periods of consistent price movement, where historical trend lines can provide meaningful insights into potential future price actions.
The indicator is particularly useful when analyzing multiple timeframes and seeking to understand the relationship between current price action and historical moving average trends. It works best when combined with other trend-confirming indicators to validate potential trading signals and improve overall market analysis.
Keep exploring
What we’ve verified
Access, alerts and repainting behaviour have not been independently verified for this indicator. Check the creator’s current publication and settings.
General descriptions and classifications are recovered research. Verified details above identify the specific checks we have completed. Check the creator’s current publication for later changes.