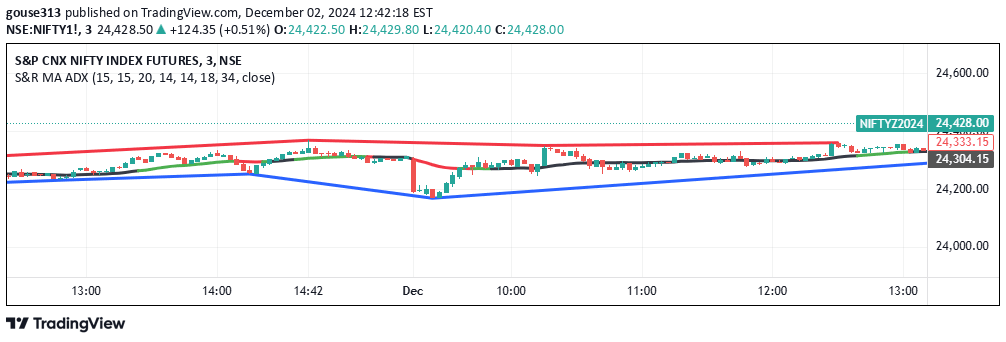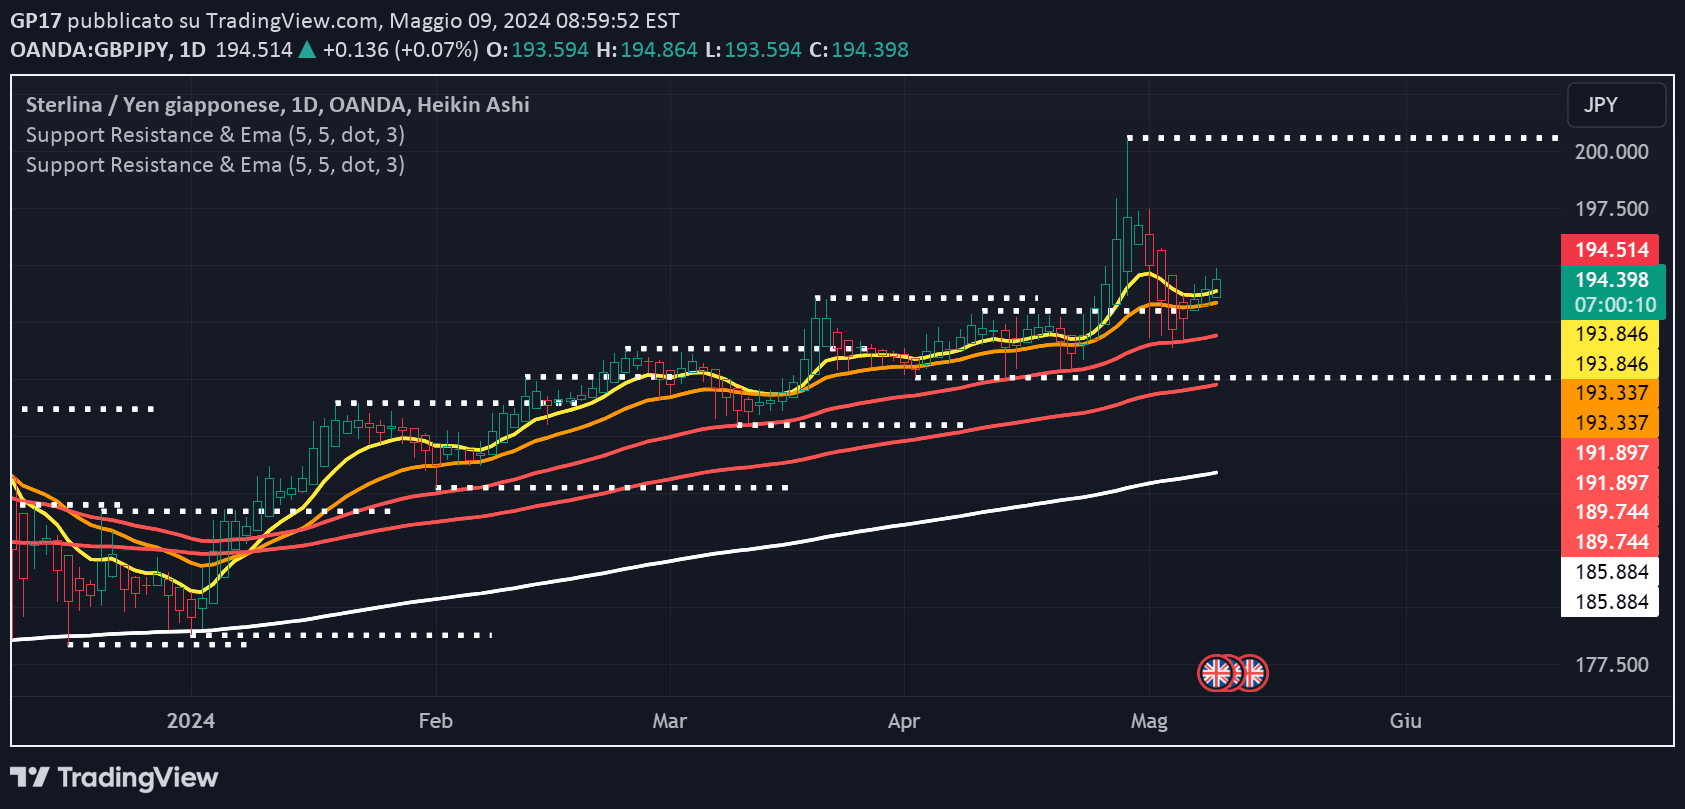
A comprehensive trading indicator that identifies support and resistance levels, tracks market trends using pivot points and exponential moving averages, and helps traders make informed decisions.
Explore complementary indicator rolesHow it works
The indicator analyzes price action by identifying pivot highs and lows to establish dynamic support and resistance levels. These levels are plotted on the chart and change color to signal potential trend reversals, providing visual cues for traders.
Additionally, the script tracks trend conditions through four key configurations: higher highs and higher lows (uptrend), lower highs and lower lows (downtrend), and transitional states that indicate potential trend weakening or reversal. Multiple exponential moving averages (9, 21, 50, 100, 200) are overlaid to further confirm trend direction and strength.
Why it may be useful
This indicator offers traders a multi-dimensional view of market dynamics by combining support/resistance analysis with trend identification. By visualizing key price levels and trend conditions, traders can make more informed decisions about potential entry and exit points.
The comprehensive approach helps reduce emotional trading by providing objective, data-driven insights into market movement. Traders can leverage these multiple analytical layers to validate trading strategies, understand market sentiment, and potentially improve overall trading performance and risk management.
When to explore it
The indicator is most effective in markets with clear trend characteristics, such as forex, stocks, and cryptocurrencies. It works best in timeframes that allow sufficient price movement to generate meaningful pivot points and trend signals, typically ranging from 5-minute to daily charts.
Traders should use this tool in conjunction with other technical and fundamental analysis methods. It is particularly useful during trending market conditions, when price is showing consistent directional movement, and when traders want to identify potential trend reversals or confirm existing market momentum.
Keep exploring
What we’ve verified
Access, alerts and repainting behaviour have not been independently verified for this indicator. Check the creator’s current publication and settings.
General descriptions and classifications are recovered research. Verified details above identify the specific checks we have completed. Check the creator’s current publication for later changes.