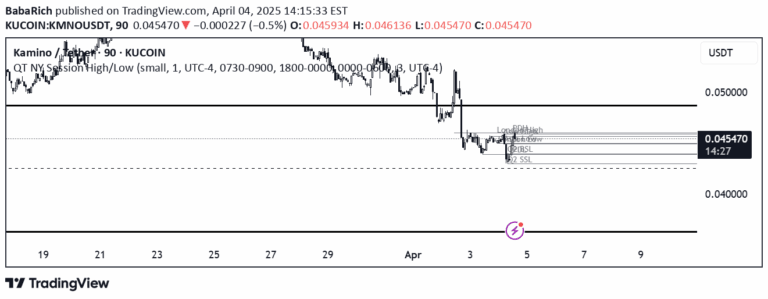
A multi-line signal generator that identifies potential support and resistance levels using price action patterns across daily timeframes, helping traders anticipate market movements.
Explore complementary indicator rolesHow it works
The signal generates multiple resistance and support lines by analyzing price action patterns across consecutive trading days. Each line type is created through specific price and volume conditions, such as pullback lines which form when two consecutive days show declining closes with rising volume.
The four line types include pullback, rising, V-shape, and 2-bar fail lines, each representing different price movement scenarios. These lines help traders identify potential trend reversals, momentum shifts, and critical price levels by examining the relationship between current and previous closing prices.
Why it may be useful
These multi-line signals provide traders with nuanced insights into potential market turning points and trend dynamics. By identifying subtle price action patterns, traders can anticipate potential support and resistance levels before they become obvious to the broader market.
The signal's strength lies in its ability to detect early warning signs of trend changes through sophisticated price and volume analysis. This approach allows traders to make more informed decisions by understanding underlying market structure and potential price movement probabilities.
When to explore it
These signals are most effective in moderately trending markets with clear price action patterns and consistent volume characteristics. Traders should apply these lines when seeking early indications of potential trend reversals or momentum shifts in daily timeframe charts.
The signal works best when combined with other technical analysis tools and volume confirmation. Traders should exercise caution and use additional confirmation indicators to validate the potential support and resistance levels generated by these lines.
Keep exploring
What we’ve verified
Access, alerts and repainting behaviour have not been independently verified for this indicator. Check the creator’s current publication and settings.
General descriptions and classifications are recovered research. Verified details above identify the specific checks we have completed. Check the creator’s current publication for later changes.