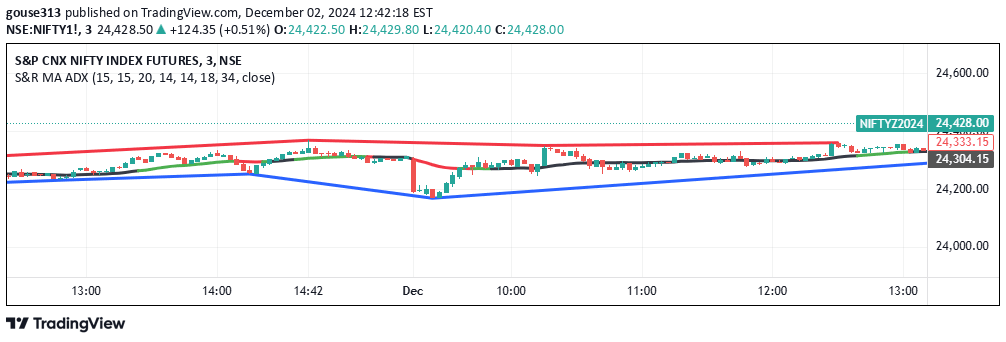
A moving average-based indicator using three MA lines to identify trend direction, support/resistance levels, and potential entry points for traders.
Explore complementary indicator rolesHow it works
This indicator utilizes three moving averages (SMA 5, SMA 20, and SMA 10) to analyze price dynamics and trend direction. The upper line (SMA 5) and lower line (SMA 20) generate bullish and bearish signals when they cross over, with a blue dotted line indicating a bullish trend and a red dotted line signaling a bearish trend.
The support/resistance line (SMA 10) provides additional context by highlighting potential entry and exit points. A red triangle appears when the price closes below this line, while a green bar signals a price breakout above the support/resistance line.
Why it may be useful
Moving average-based indicators are crucial for traders as they help smooth out price fluctuations and provide clear visual representations of market trends. By combining multiple moving averages, traders can gain insights into potential trend changes, momentum shifts, and key support and resistance levels.
The signal's versatility allows traders to customize the indicator to their specific trading style, such as focusing on a single moving average or using multiple lines to confirm trade entries and exits.
When to explore it
This indicator is most effective in trending markets where price movement shows consistent directional momentum. Traders can use it to identify potential entry points during bullish or bearish trends, particularly when looking for crossover signals or price interactions with moving averages.
It works best on intraday and short-term timeframes, making it particularly useful for scalping and day trading strategies. Traders should combine this indicator with other technical analysis tools to confirm signals and reduce false positives.
Keep exploring
What we’ve verified
Access, alerts and repainting behaviour have not been independently verified for this indicator. Check the creator’s current publication and settings.
General descriptions and classifications are recovered research. Verified details above identify the specific checks we have completed. Check the creator’s current publication for later changes.