
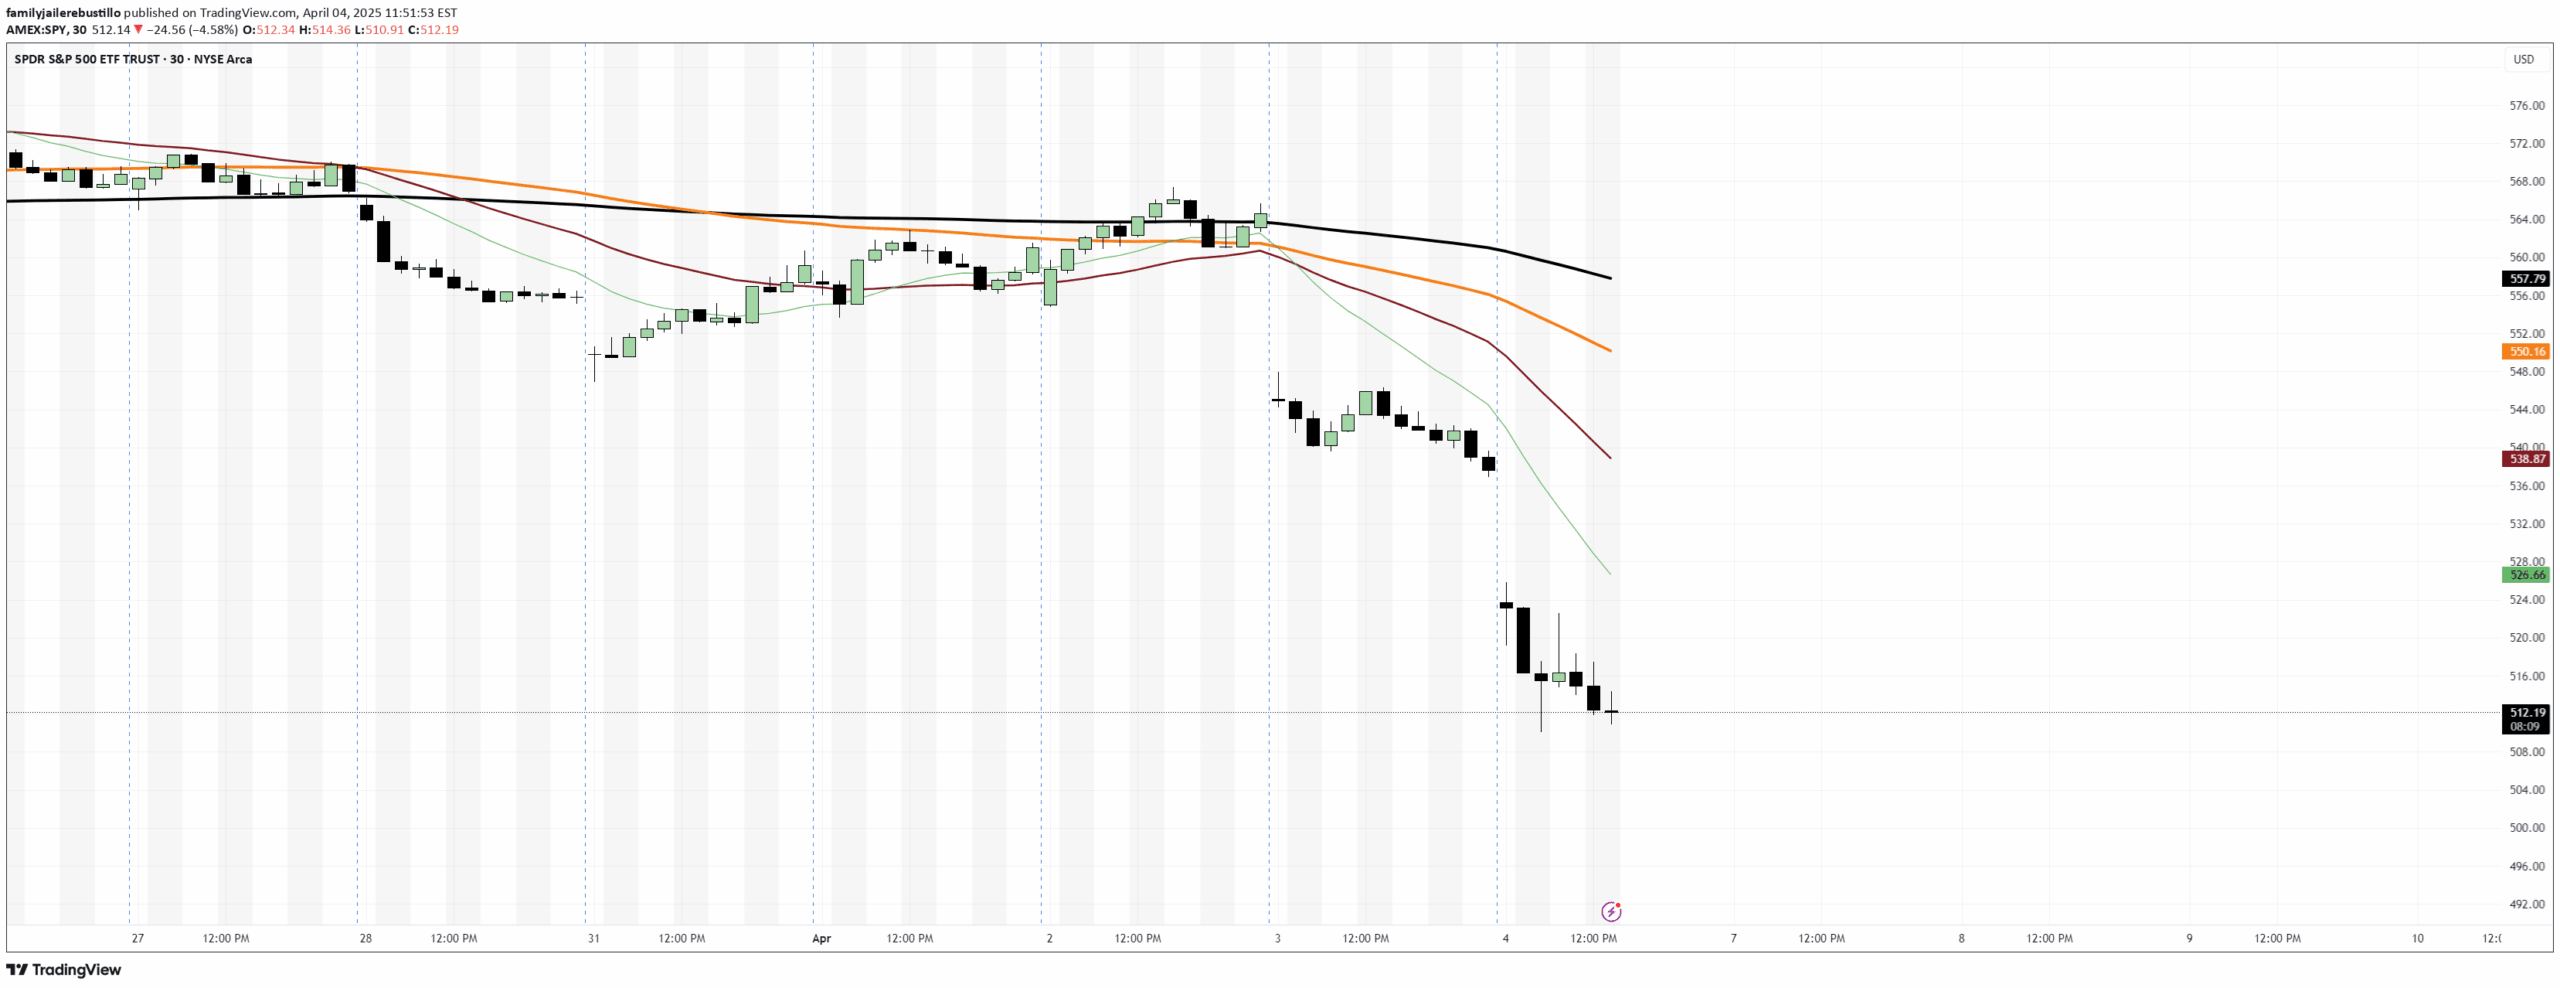
A TradingView indicator that visually highlights hourly intervals during the NYSE trading session using background shading, helping traders easily track price movement within specific time segments.
Explore complementary indicator rolesHow it works
The indicator segments the NYSE trading session into hourly intervals from 9:30 AM to 4:00 PM ET, applying different background shading patterns to distinguish each time block. Transparent backgrounds are used for 9:30-10:00, 11:00-12:00, 13:00-14:00, and 15:00-16:00 intervals.
Very light gray backgrounds are applied to 10:00-11:00, 12:00-13:00, and 14:00-15:00 intervals. The shading is restricted to chart timeframes of 30 minutes or less and only appears during NYSE session hours
Why it may be useful
This indicator provides traders with a clean, visual method to track price movements within specific hourly segments of the trading day. By offering a simple background shading technique, it helps traders quickly identify and analyze different time intervals without complex overlays.
The alternating background colors make it easier to distinguish between consecutive hourly blocks, enhancing visual comprehension of intraday price action
When to explore it
This indicator is most effective for intraday traders focusing on the NYSE trading session. It works best when analyzing short-term timeframes like 30-minute, 15-minute, 5-minute, and 1-minute charts.
Traders can use it to observe potential price patterns, momentum shifts, and trading activity within specific hourly segments. It is particularly useful for day traders who want a quick, unobtrusive visual guide to track market movements
Keep exploring
What we’ve verified
Access, alerts and repainting behaviour have not been independently verified for this indicator. Check the creator’s current publication and settings.
General descriptions and classifications are recovered research. Verified details above identify the specific checks we have completed. Check the creator’s current publication for later changes.


