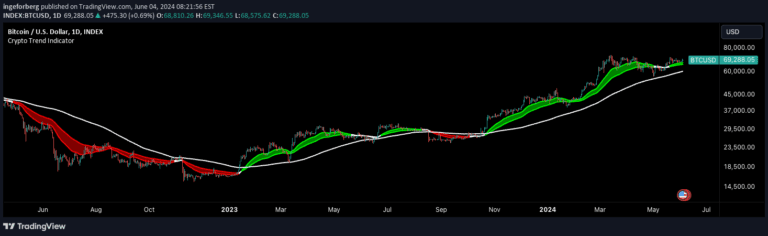
A custom trend indicator that identifies market trends and reversals using price action analysis, displaying trend lines and directional arrows to help traders recognize potential trading opportunities.
Explore complementary indicator rolesHow it works
The Custom Trend Indicator analyzes price action by comparing current and previous candlestick data to determine trend direction. It uses a systematic approach to evaluate high, low, and close prices to classify market conditions as uptrend, downtrend, or no trend. The indicator generates color-coded lines that visually represent the current market trend, with green lines indicating uptrends and red lines signaling downtrends.
The script incorporates a customizable line offset multiplier that allows traders to adjust the visual distance between trend lines and candlesticks. This feature enhances the indicator's readability and helps traders more easily interpret market movements. Additionally, the indicator plots directional arrows at potential trend reversal points, providing clear visual signals about possible changes in market momentum.
Why it may be useful
Trend identification is crucial for traders seeking to understand market dynamics and make informed trading decisions. This indicator simplifies the complex process of trend analysis by providing clear, visual representations of market direction, which can help traders quickly assess the current market sentiment. By offering an intuitive way to recognize trend changes, the indicator reduces the cognitive load of manual trend detection.
The visual arrows and color-coded lines make it easier for traders to spot potential entry and exit points, potentially improving trading accuracy and decision-making. The customizable nature of the indicator allows traders to adapt it to their specific trading style and preferences, making it a versatile tool for multiple trading approaches and market conditions.
When to explore it
The Custom Trend Indicator is most effective in markets with clear directional movements, such as trending stock, forex, or cryptocurrency markets. It works best when price action shows consistent directional movement, allowing the indicator to accurately identify and highlight trend changes. Traders can benefit from using this tool in various timeframes, from short-term scalping to longer-term swing trading strategies.
The indicator is particularly useful during periods of market volatility when rapid trend changes can occur. By providing quick visual cues about potential trend reversals, it can help traders make more timely decisions about entering or exiting positions. However, traders should always combine this indicator with other technical analysis tools and fundamental research to confirm signals and manage risk effectively.
Keep exploring
What we’ve verified
Access, alerts and repainting behaviour have not been independently verified for this indicator. Check the creator’s current publication and settings.
General descriptions and classifications are recovered research. Verified details above identify the specific checks we have completed. Check the creator’s current publication for later changes.