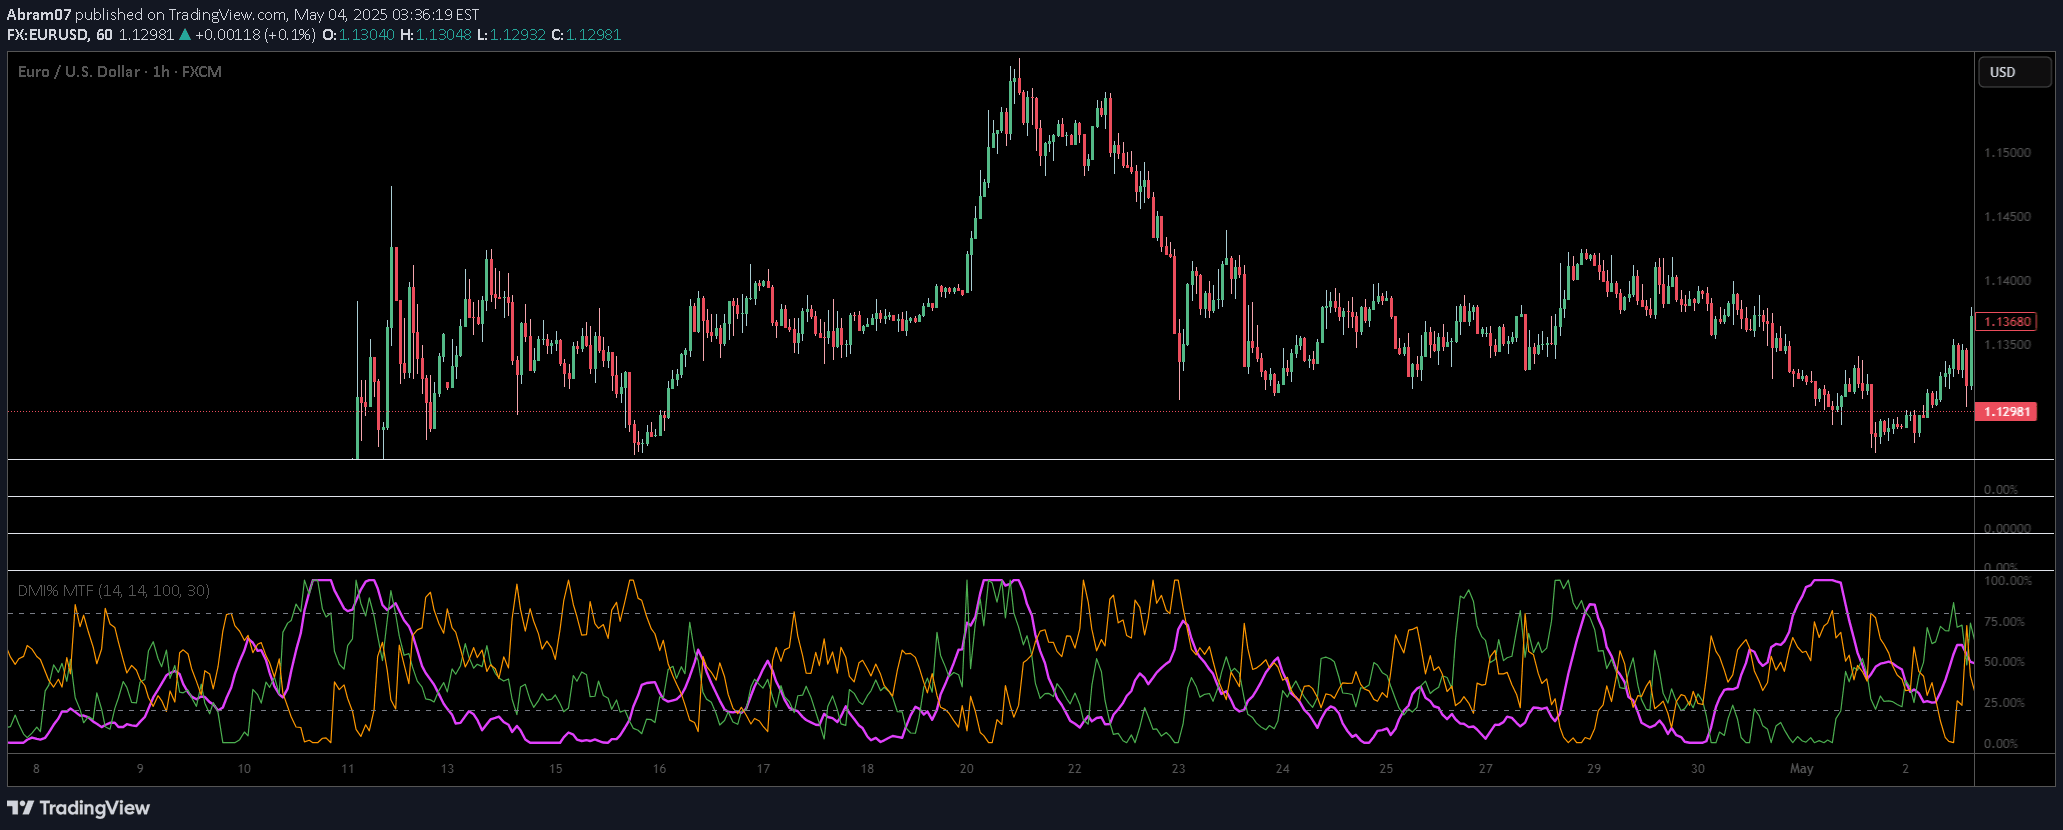
An advanced ADX indicator using Hull Moving Average to detect trend strength and direction more quickly and accurately than traditional methods.
Explore complementary indicator rolesHow it works
The ADX + DMI (HMA Version) combines the Directional Movement Index (DMI) with the Hull Moving Average to analyze trend strength and direction. It uses three primary lines: a blue ADX line measuring trend strength, a green DI+ line showing bullish momentum, and a red DI- line indicating bearish momentum.
The indicator calculates these lines using customizable length parameters, with the Hull Moving Average providing faster and more responsive trend detection compared to traditional exponential moving averages. When the DI+ crosses above the DI-, it signals a potential uptrend, while a DI- crossing above DI+ suggests a potential downtrend.
Why it may be useful
This indicator helps traders quickly identify and confirm market trends by providing a more dynamic and responsive analysis of price movement. By using the Hull Moving Average, it reduces lag and filters out choppy market conditions, allowing traders to make more informed decisions about market direction.
The ADX + DMI (HMA Version) offers a sophisticated approach to trend analysis, enabling traders to distinguish between strong trending markets and ranging conditions. Its ability to provide faster signals and reduce false trend indications makes it a valuable tool for traders seeking to improve their market entry and exit strategies.
When to explore it
The ADX + DMI (HMA Version) is most effective in markets with clear directional movements, particularly in short-term trading scenarios like cryptocurrency and forex markets. It works best on shorter timeframes, such as 5-minute charts, where rapid trend identification is crucial for making quick trading decisions.
Traders should use this indicator when they want to confirm trend strength, identify potential trend reversals, and filter out low-quality trading opportunities. It is particularly useful when the ADX is above 25, indicating a strong trend, and when clear crossovers between DI+ and DI- lines occur.
Keep exploring
What we’ve verified
Access, alerts and repainting behaviour have not been independently verified for this indicator. Check the creator’s current publication and settings.
General descriptions and classifications are recovered research. Verified details above identify the specific checks we have completed. Check the creator’s current publication for later changes.