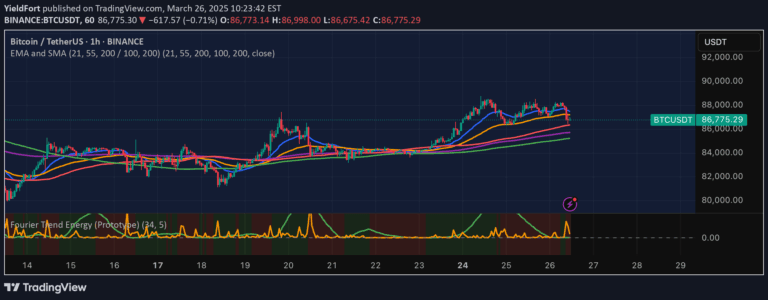
The Daily Factor Indicator is a volatility tool comparing price bar body and range to assess market volatility, providing insights through color-coded signals based on moving average positioning.
Explore complementary indicator rolesHow it works
The Daily Factor Indicator calculates volatility by comparing the absolute difference between previous open and close prices (body) to the difference between previous high and low prices (range). By dividing body by range, the indicator generates a value between 0 and 1, with values closer to 1 representing higher volatility and values closer to 0 indicating lower volatility.
A simple moving average is used to determine buy and sell signals and color coding. The indicator's color changes based on the price's relationship to the moving average, with darker colors signaling values above the threshold and lighter colors indicating values below the threshold.
Why it may be useful
The Daily Factor Indicator provides traders with a quick and intuitive way to assess market volatility, helping them understand price movement dynamics and potential trading opportunities. By visualizing volatility through color-coded signals, traders can quickly gauge market conditions and make more informed trading decisions.
Unlike many complex volatility indicators, this tool offers a straightforward approach to understanding market behavior, making it accessible to traders of various skill levels. The combination of volatility measurement and moving average positioning creates a comprehensive view of market trends and potential entry or exit points.
When to explore it
The Daily Factor Indicator is most effective in markets with clear directional movements and consistent volatility patterns, such as stocks, futures, and forex. Traders can use this indicator to identify potential trading opportunities during periods of changing market volatility, particularly when combined with other technical analysis tools.
It works best for short-term trading strategies like scalping and day trading, where quick market condition assessments are crucial. Traders should experiment with different threshold levels and combine the indicator with additional confirmation signals to improve its reliability and effectiveness in their trading approach.
Keep exploring
What we’ve verified
Access, alerts and repainting behaviour have not been independently verified for this indicator. Check the creator’s current publication and settings.
General descriptions and classifications are recovered research. Verified details above identify the specific checks we have completed. Check the creator’s current publication for later changes.