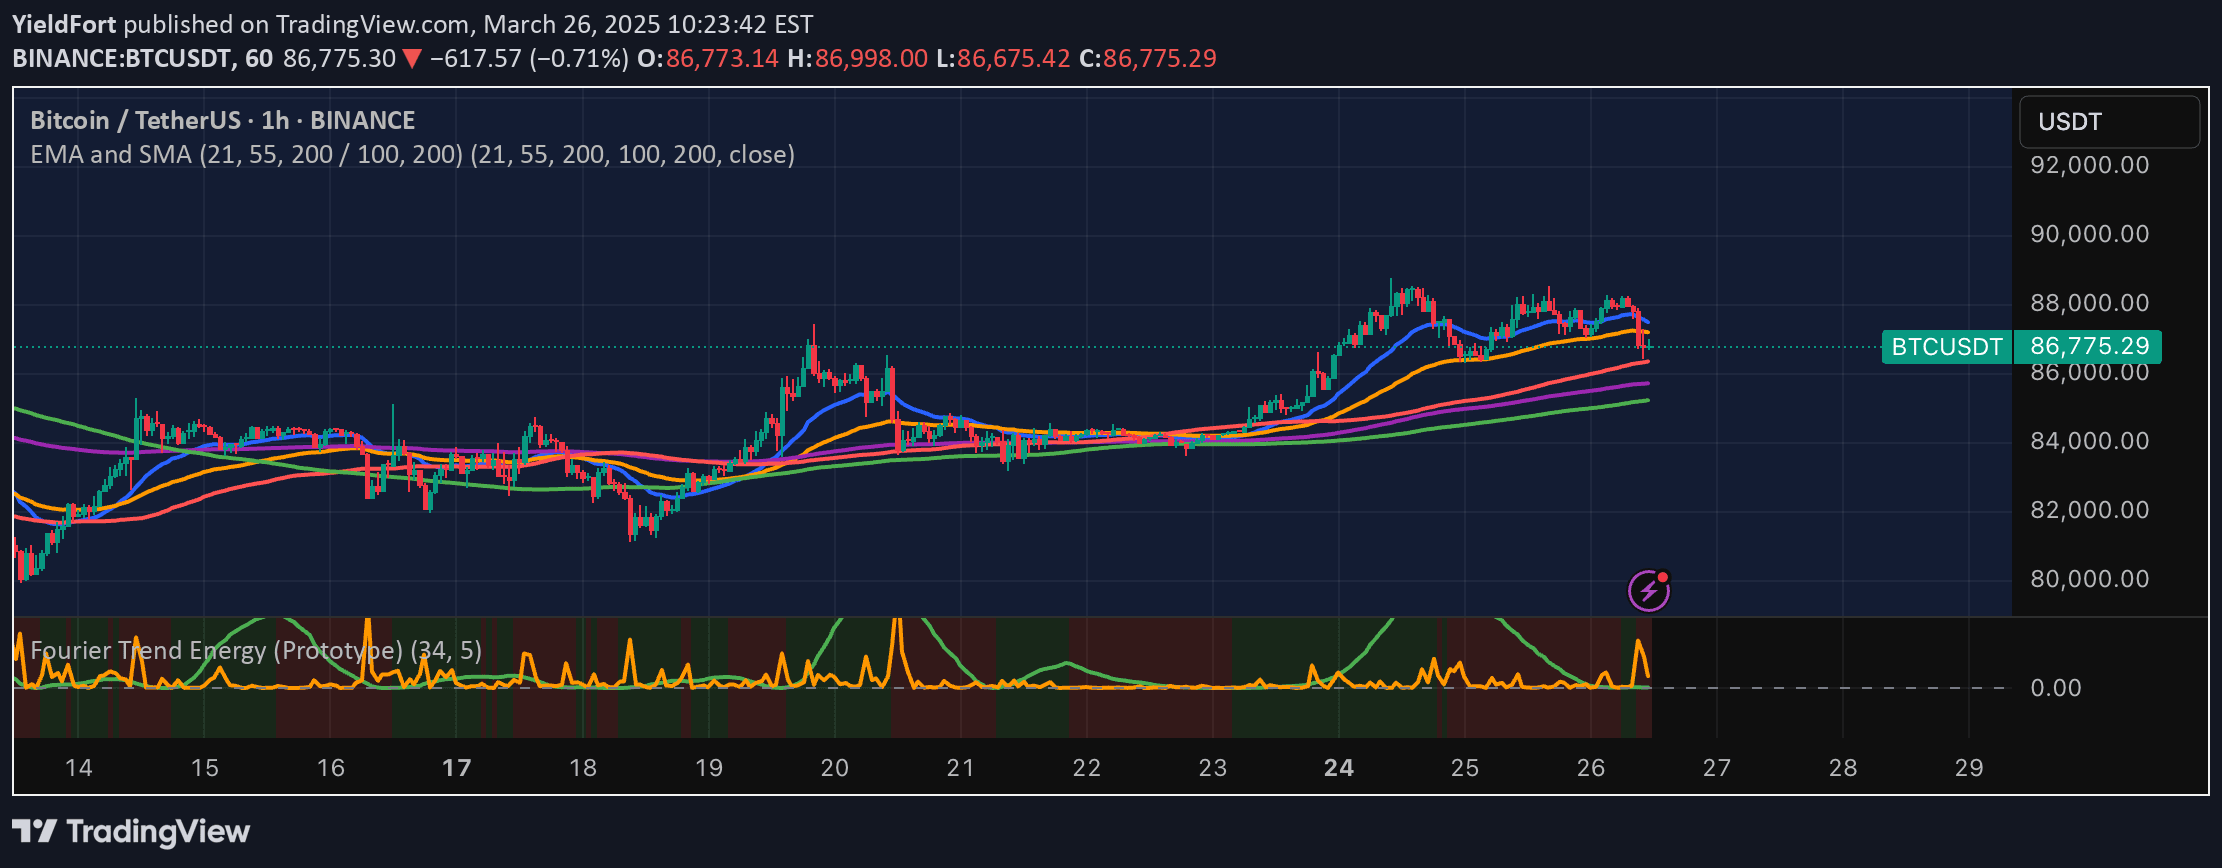
A Fourier-based trend analysis tool that measures market energy by separating low-frequency trend strength from high-frequency noise, helping traders understand potential market movements.
Explore complementary indicator rolesHow it works
The Fourier Trend Energy indicator uses frequency analysis to decompose price data into two primary components: low-frequency and high-frequency energy. The green line represents trend strength by capturing underlying market momentum, while the orange line indicates short-term noise and volatility.
By analyzing these energy levels, traders can understand the underlying market dynamics and potential trend formations. The indicator calculates energy levels using mathematical transformations that separate meaningful trend signals from random price fluctuations
Why it may be useful
Understanding market energy is crucial for traders seeking to make informed decisions. This indicator provides a unique perspective on market movements by distinguishing between meaningful trend signals and temporary noise.
By visualizing trend strength and volatility, traders can better assess market conditions, reduce false signal risks, and improve trade entry and exit strategies. The tool helps identify potential momentum shifts and provides insights into the market's underlying energy and directional bias
When to explore it
The Fourier Trend Energy indicator works best during trending and transitional market conditions. It is particularly useful when markets are experiencing potential trend reversals or consolidation periods.
Traders should apply this tool across different asset classes and timeframes to validate trend strength and filter out false breakouts. It is most effective when combined with other technical analysis tools and used in conjunction with price action and additional momentum indicators
Keep exploring
What we’ve verified
Access, alerts and repainting behaviour have not been independently verified for this indicator. Check the creator’s current publication and settings.
General descriptions and classifications are recovered research. Verified details above identify the specific checks we have completed. Check the creator’s current publication for later changes.