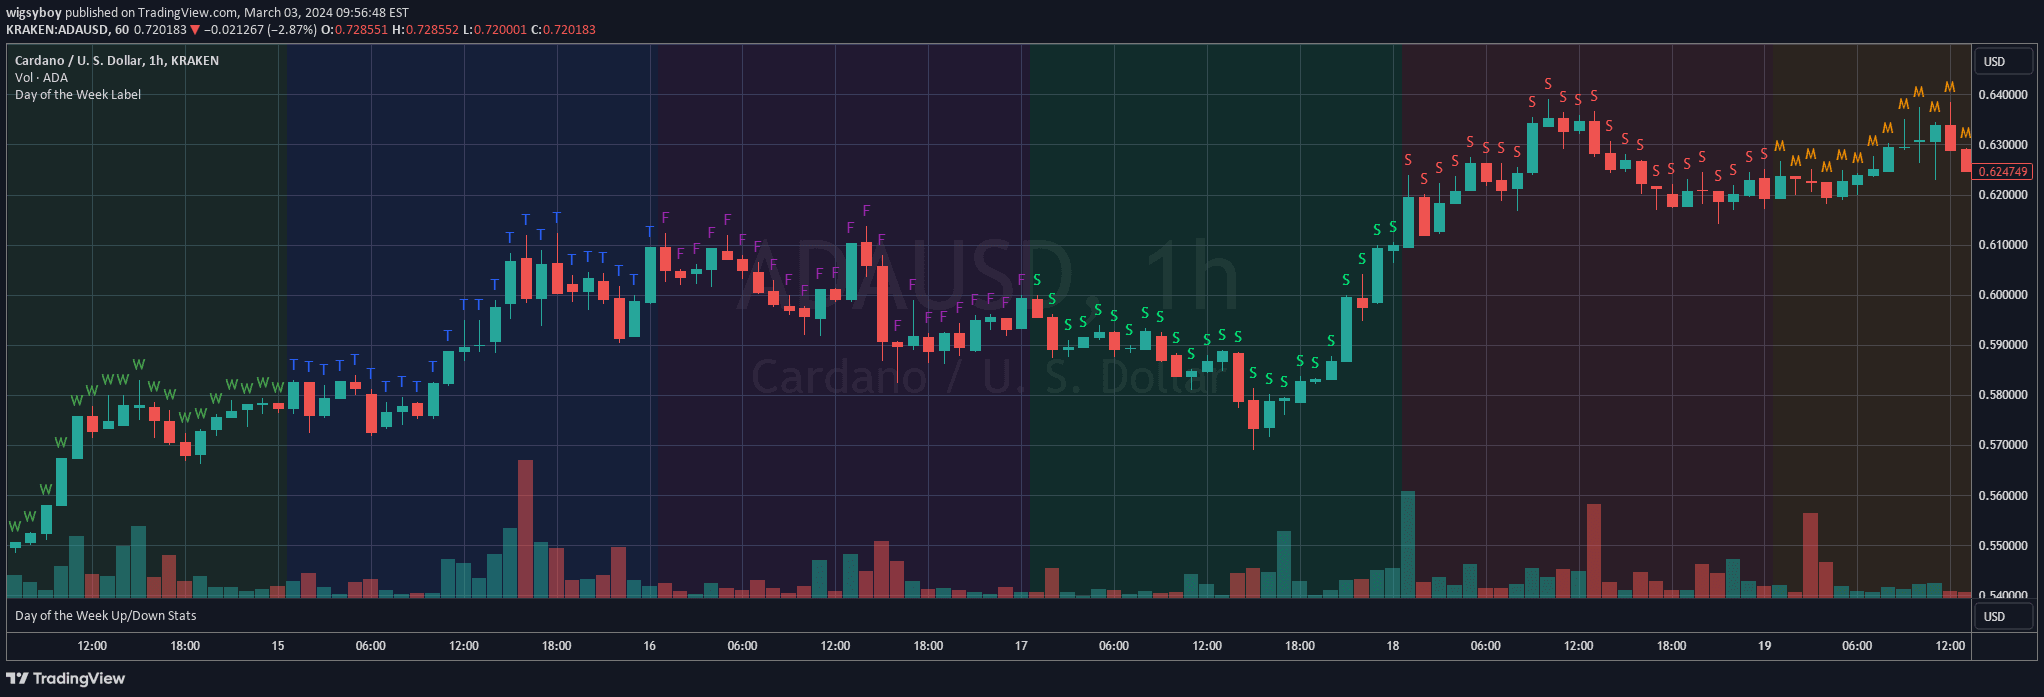
A dynamic trading script that calculates and displays the daily percentage change near the current price, providing real-time performance visualization across different timeframes.
Explore complementary indicator rolesHow it works
The script uses request.security to fetch the previous day's closing price across any timeframe, calculating the percentage change relative to the current price. It dynamically creates a label positioned near the current price, using a semi-transparent background that changes color based on the price movement's direction.
The calculation is performed only on the last bar of the chart to optimize performance, ensuring real-time updates. The label provides an instant visual representation of daily price performance, with green indicating positive changes and red indicating negative changes.
Why it may be useful
Traders need quick, accurate insights into daily price performance, and this script provides an immediate, visually intuitive way to understand market movement. By showing percentage change directly on the chart, it helps traders rapidly assess the day's price action without complex calculations or switching between different views.
The color-coded label offers instant comprehension of market sentiment, allowing traders to quickly identify bullish or bearish momentum. This immediate visual feedback can support faster decision-making and provide context for current price levels relative to the previous day's close.
When to explore it
This signal is most effective for traders who want real-time visibility into daily price performance across multiple timeframes. It's particularly useful for day traders and swing traders who need to quickly understand market direction and daily momentum without manual calculations.
The script works best when used in conjunction with other technical analysis tools, providing a quick snapshot of price movement. Traders can benefit from this indicator in volatile markets, trending conditions, and when tracking short-term price changes across stocks, indices, cryptocurrencies, and other financial instruments.
Keep exploring
What we’ve verified
Access, alerts and repainting behaviour have not been independently verified for this indicator. Check the creator’s current publication and settings.
General descriptions and classifications are recovered research. Verified details above identify the specific checks we have completed. Check the creator’s current publication for later changes.