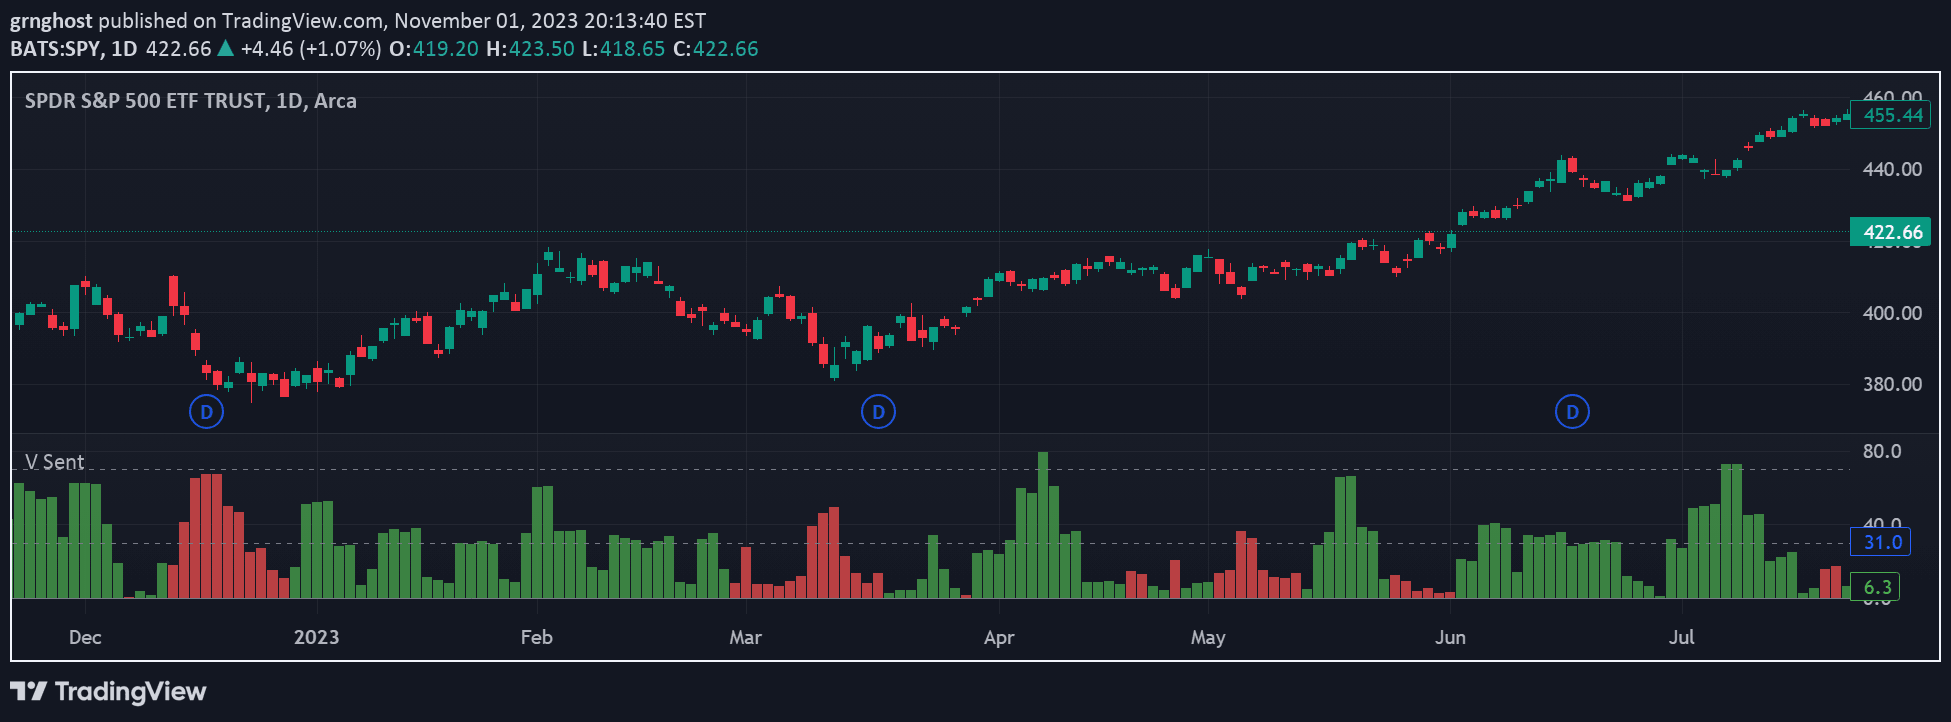
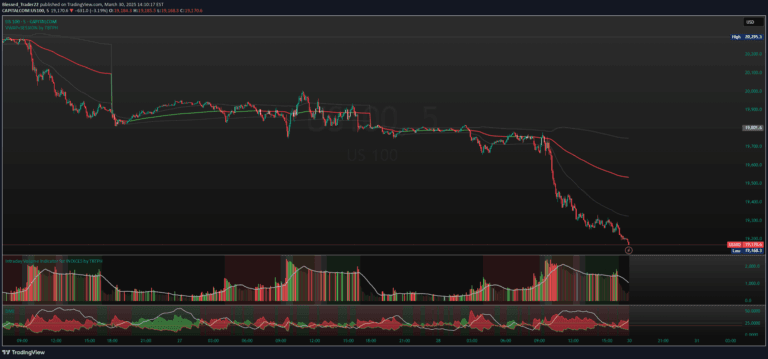
An advanced volume spike detector that analyzes trading volume with price direction, categorizing volume events as bullish, bearish, neutral, or strong with color-coded visual indicators.
Explore complementary indicator rolesHow it works
The Enhanced Volume Spike Detector operates by comparing current trading volume against a moving average baseline, identifying significant deviations. It calculates volume spikes using a default multiplier of 1.5-2.0 times the standard moving average volume, which allows for dynamic and adaptive volume analysis.
Beyond simple volume measurement, the indicator categorizes volume events based on price movement direction. It distinguishes between bullish (upward price), bearish (downward price), neutral (minimal price change), and strong volume spikes, providing traders with a nuanced understanding of market momentum and potential trend strength.
Why it may be useful
Volume analysis is crucial for understanding market dynamics and confirming price movements, offering insights into trader sentiment and potential trend reversals. By providing a comprehensive view of volume behavior, traders can make more informed decisions about market entry and exit points.
The color-coded classification system enables quick visual interpretation of volume events, allowing traders to rapidly assess market conditions without extensive computational analysis. This immediate visual feedback can help traders recognize potential trading opportunities and make faster, more strategic decisions.
When to explore it
This volume spike detector is most effective in liquid markets with consistent trading activity, such as major stock indices, forex pairs, and heavily traded commodities. It performs exceptionally well during periods of market transition, helping traders identify potential trend changes and momentum shifts.
Traders should adjust the indicator's parameters based on their specific trading timeframe and strategy. For day trading, shorter moving average lengths work best, while swing and position traders might prefer longer periods. The flexibility in multiplier settings allows customization to match individual risk tolerance and trading style.
Keep exploring
What we’ve verified
Access, alerts and repainting behaviour have not been independently verified for this indicator. Check the creator’s current publication and settings.
General descriptions and classifications are recovered research. Verified details above identify the specific checks we have completed. Check the creator’s current publication for later changes.