
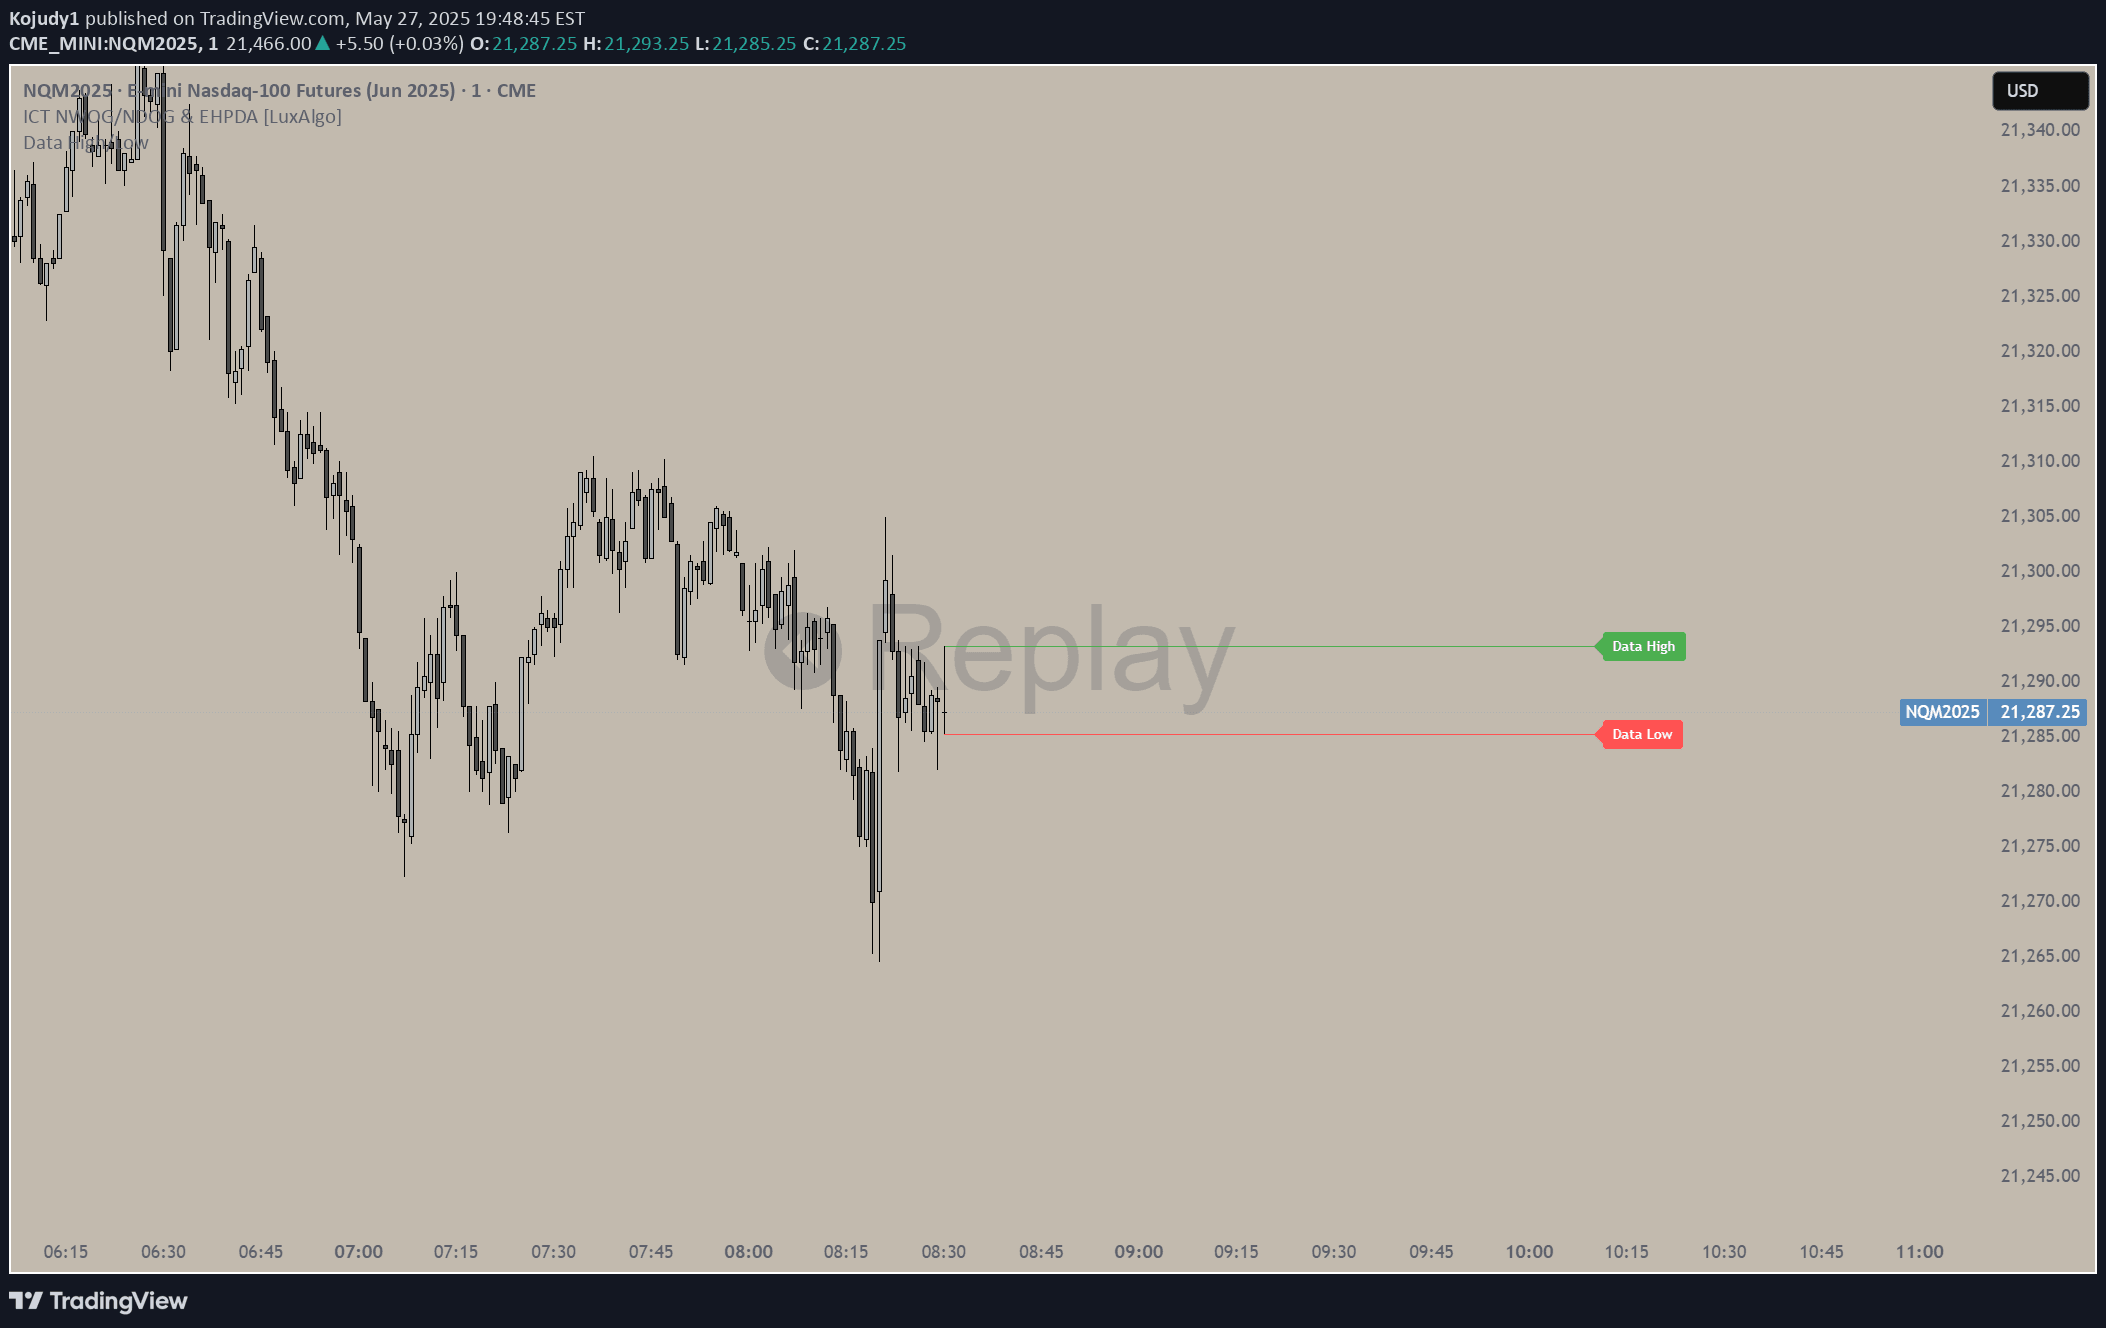
A trading signal that marks the high and low points of a specific news candle, offering customizable visual representation of price extremes for precise trading insights.
Explore complementary indicator rolesHow it works
The signal identifies and draws horizontal lines at the precise high and low points of a designated candle, typically focusing on news-related price movements. These lines are dynamically created with customizable settings, allowing traders to adjust line color, time, and length according to their specific analysis preferences.
The indicator operates exclusively on 1-minute and lower timeframes, ensuring granular precision for traders seeking detailed price action insights. By highlighting the exact price extremes of a specific candle, the signal provides a clear visual reference for potential support, resistance, and trading decision points.
Why it may be useful
This signal offers traders a precise visual tool for understanding price dynamics during critical market moments, particularly around news events that can cause significant price volatility. By marking exact high and low points, traders can quickly identify potential entry and exit levels, enhancing their ability to make informed trading decisions.
The customizable nature of the signal allows traders to adapt the visual representation to their specific trading style and preferences. This flexibility, combined with the focus on granular timeframes, makes the signal a valuable tool for traders seeking to capture short-term price movements with increased accuracy and strategic insight.
When to explore it
The signal is most effective during periods of high market volatility, especially around significant news events that can cause rapid price fluctuations. Traders can utilize this tool to quickly identify and mark important price levels that might serve as potential support or resistance points during these dynamic market conditions.
Particularly useful for scalpers and day traders operating on 1-minute and lower timeframes, the signal provides a quick visual reference for price extremes. It is especially valuable when trading instruments that are sensitive to news announcements, such as forex pairs, stock indices, and cryptocurrencies where precise entry and exit points can make a significant difference in trading outcomes.
Keep exploring
What we’ve verified
Access, alerts and repainting behaviour have not been independently verified for this indicator. Check the creator’s current publication and settings.
General descriptions and classifications are recovered research. Verified details above identify the specific checks we have completed. Check the creator’s current publication for later changes.


