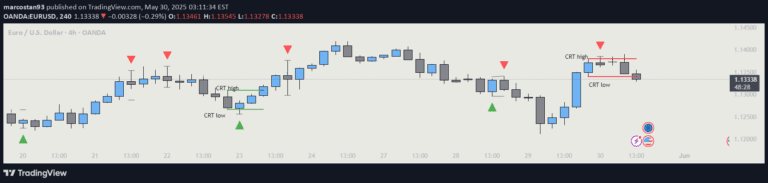
A candle tool that calculates and visualizes the price range between the highest and lowest points within individual candlesticks, offering quick insights into market volatility and price movement.
Explore complementary indicator rolesHow it works
The Day High-Low Difference tool tracks the vertical distance between the highest and lowest price points of each individual candlestick on a trading chart. It computes this range by subtracting the lowest price from the highest price during the specific time period of the candle, which could represent minutes, hours, or days depending on the chart's timeframe.
By quantifying this price range, the tool provides traders with a visual and numerical representation of price volatility within each candle. The larger the difference between the high and low prices, the more significant the price movement and potential market uncertainty during that specific trading period.
Why it may be useful
Understanding the day high-low difference helps traders assess market volatility and potential price action dynamics within specific trading periods. By revealing the extent of price fluctuations, this tool provides critical insights into market sentiment, trader behavior, and potential trend strength or weakness.
Traders can use this information to make more informed decisions about entry and exit points, risk management, and potential trading strategies. The visual representation of price range can help identify periods of increased market activity or potential trend reversals.
When to explore it
The Day High-Low Difference tool is most effective during periods of significant market movement or when analyzing short-term price action. It works particularly well in volatile markets where price ranges can vary dramatically within short time frames, such as during economic announcements or earnings reports.
Traders should pay special attention to candles with unusually large high-low differences, as these might indicate potential trend changes, breakouts, or significant market uncertainty. The tool is especially useful for scalpers and day traders who rely on quick, precise market analysis.
Keep exploring
What we’ve verified
Access, alerts and repainting behaviour have not been independently verified for this indicator. Check the creator’s current publication and settings.
General descriptions and classifications are recovered research. Verified details above identify the specific checks we have completed. Check the creator’s current publication for later changes.