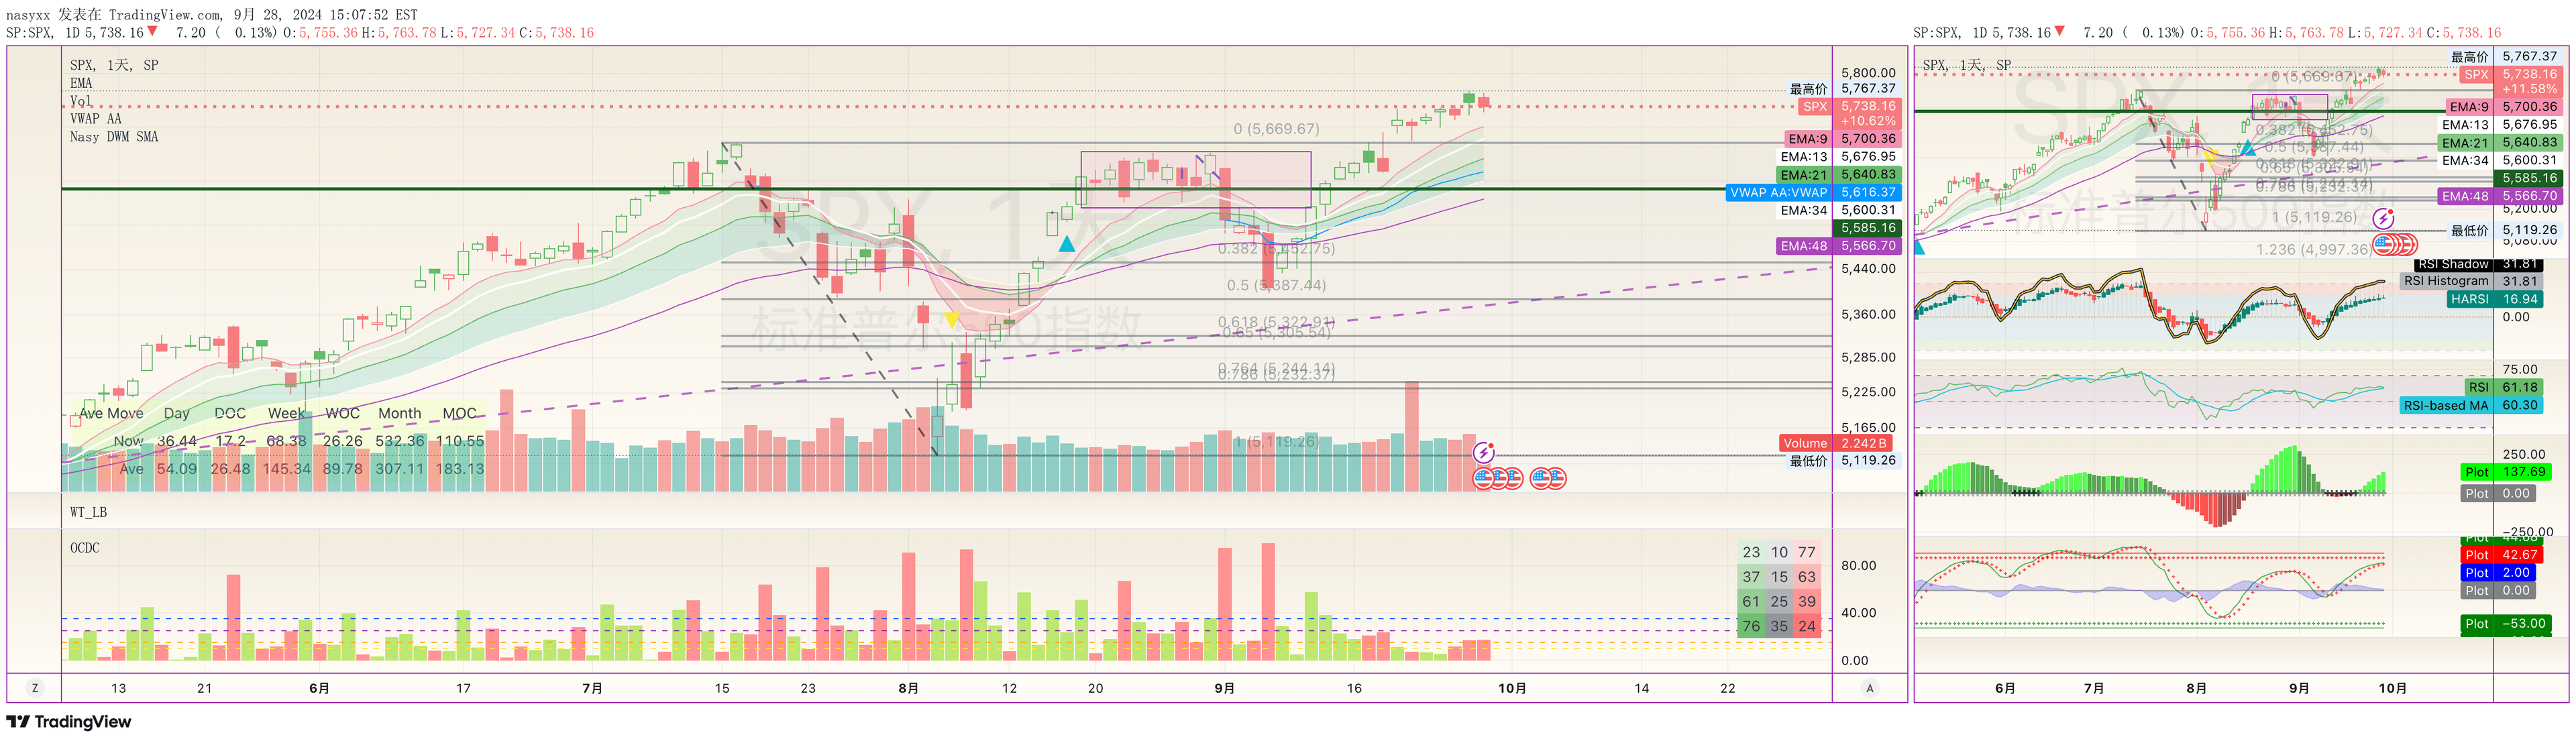
The High-Low Difference indicator calculates price volatility by measuring the range between high and low prices within a specified timeframe, offering insights into market movement and potential trading opportunities.
Explore complementary indicator rolesHow it works
The High-Low Difference indicator operates by subtracting the lowest price from the highest price within a selected time period, effectively quantifying the price range. This calculation provides a direct measurement of price movement volatility, revealing how much an asset's price has fluctuated during the specified timeframe.
Traders can customize the indicator by adjusting the time period, allowing for flexibility in analyzing different market conditions and trading styles. By comparing high-low differences across various timeframes, investors can gain a comprehensive understanding of an asset's price behavior and potential market dynamics.
Why it may be useful
The High-Low Difference indicator is crucial for traders seeking to understand market volatility and potential price movements. By providing a clear metric of price range, it helps investors assess the intensity of market activity and make more informed trading decisions based on price fluctuations.
This indicator serves as a valuable tool for risk management, enabling traders to identify periods of high and low volatility. Understanding these variations can help traders adjust their strategies, set appropriate stop-loss levels, and anticipate potential breakouts or consolidation periods in the market.
When to explore it
The High-Low Difference indicator is most effective during periods of significant market activity or when analyzing assets with potentially volatile price movements. Traders can utilize this indicator to identify emerging trends, assess market sentiment, and detect potential trading opportunities across different financial instruments.
It is particularly useful during market transitions, such as when an asset is transitioning from a consolidation phase to a potential breakout. Traders can also employ this indicator in conjunction with other technical analysis tools to validate signals and enhance their overall trading strategy.
Keep exploring
What we’ve verified
Access, alerts and repainting behaviour have not been independently verified for this indicator. Check the creator’s current publication and settings.
General descriptions and classifications are recovered research. Verified details above identify the specific checks we have completed. Check the creator’s current publication for later changes.