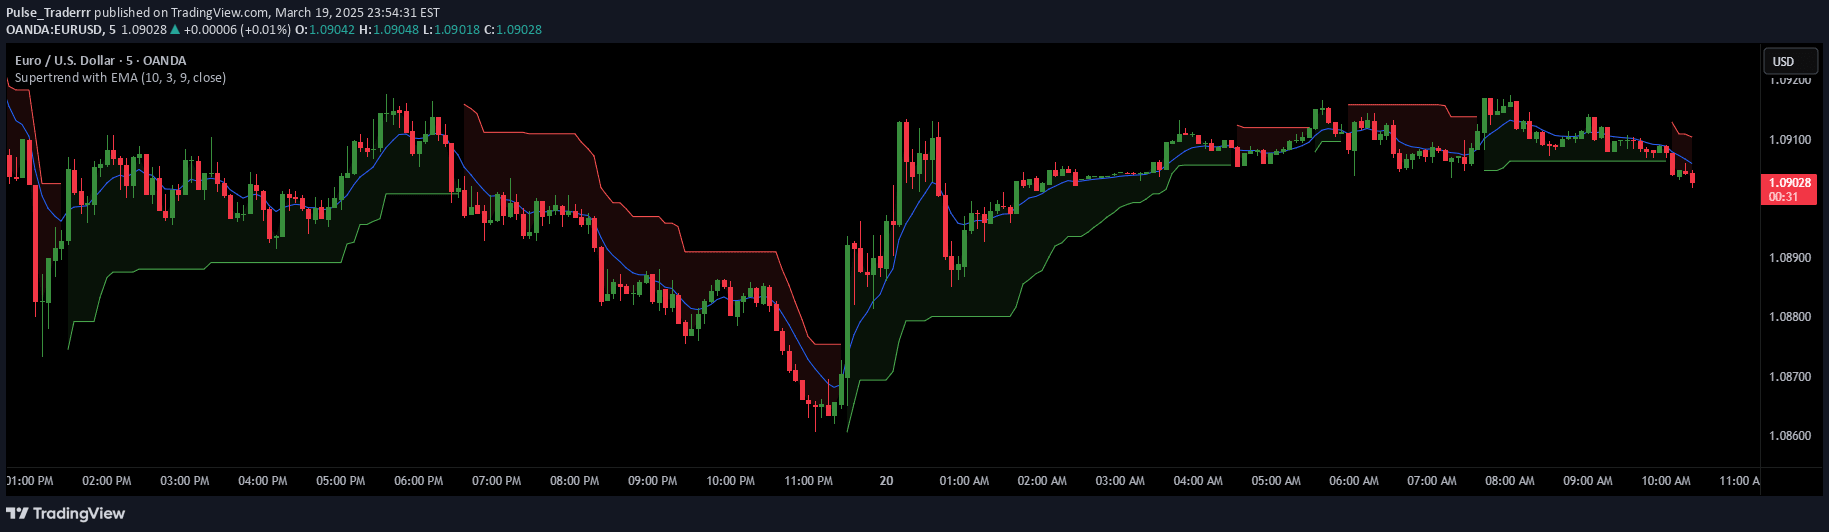
A versatile trading indicator combining multiple moving averages with an ADR table, designed to help traders identify trend dynamics and market volatility through customizable overlay.
Explore complementary indicator rolesHow it works
The indicator plots multiple moving averages using both Exponential Moving Average (EMA) and Simple Moving Average (SMA) across different time periods from 10 to 200 periods. These moving averages are displayed as dotted points for EMAs and solid lines for SMAs, allowing traders to visually track price trend changes and momentum shifts. Each moving average line can be individually toggled on or off, providing maximum customization.
Alongside the moving averages, the indicator includes an Average Daily Range (ADR) information table that displays critical volatility metrics. The table shows the average market range, today's current range, and the percentage of the ADR, giving traders immediate insight into potential price movement boundaries and volatility conditions.
Why it may be useful
Moving averages are crucial tools for understanding market trends, helping traders identify potential trend directions, support and resistance levels, and momentum shifts. By offering multiple moving average types and periods, this indicator provides a comprehensive view of price action across different timeframes, enabling traders to make more informed decisions based on trend dynamics.
The ADR table adds significant value by quantifying market volatility, which is essential for risk management and trade planning. Knowing the average daily range and current range percentage helps traders set more accurate stop-loss levels, determine potential profit targets, and assess whether current market conditions align with their trading strategy.
When to explore it
This indicator is most effective during trending market conditions where price is showing clear directional movement. Traders can use the moving averages to confirm trend strength, with crossovers between different period moving averages signaling potential trend changes or momentum shifts. The multiple MA periods allow for comprehensive trend analysis across short, medium, and long-term perspectives.
The ADR table becomes particularly valuable during periods of changing market volatility or when trading instruments with variable range characteristics. Intraday and swing traders can leverage this information to adjust their position sizing, set more precise entry and exit points, and manage risk more effectively by understanding the current market's typical price movement range.
Keep exploring
What we’ve verified
Access, alerts and repainting behaviour have not been independently verified for this indicator. Check the creator’s current publication and settings.
General descriptions and classifications are recovered research. Verified details above identify the specific checks we have completed. Check the creator’s current publication for later changes.